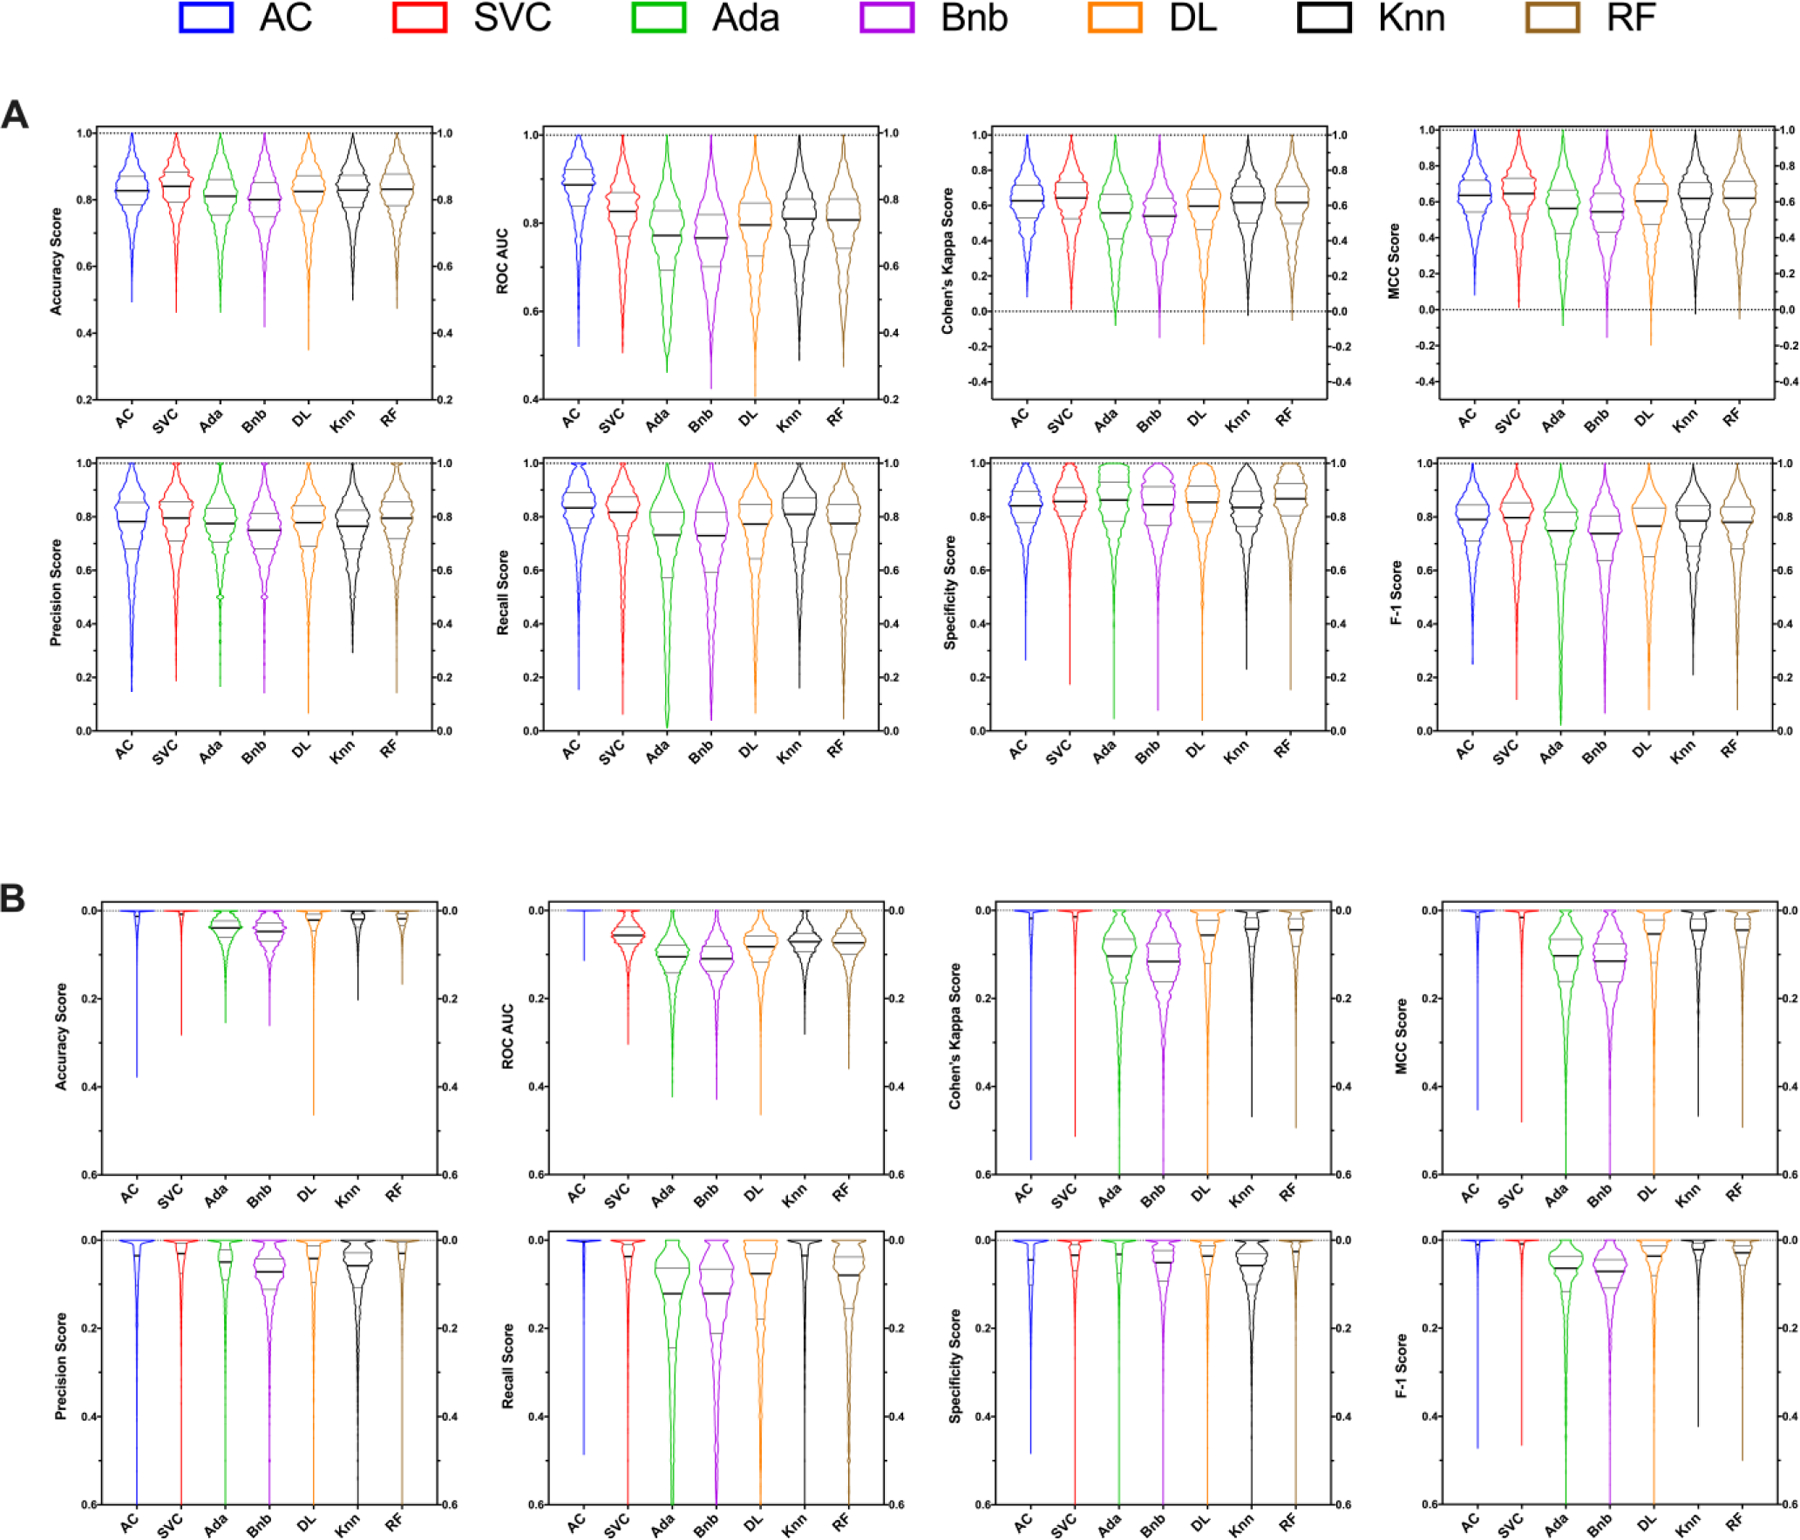
Figure 2.

Machine learning algorithm comparisons for ChEMBL datasets across multiple five-fold cross-validation using multiple classical metrics. Distributions are show as either a raw score (A) or as a ‘difference from the top’ metric score (B). Truncated violin plots are shown with minimal smoothing to retain an accurate distribution representation. The solid central line represents the median with the quarterlies indicated. AC = Assay Central (Bayesian), RF = Random Forest, Knn = k-Nearest Neighbors, SVC = Support Vector Classification, Bnb = Naïve Bayesian, Ada = AdaBoosted Decision Trees, DL = Deep Learning.
