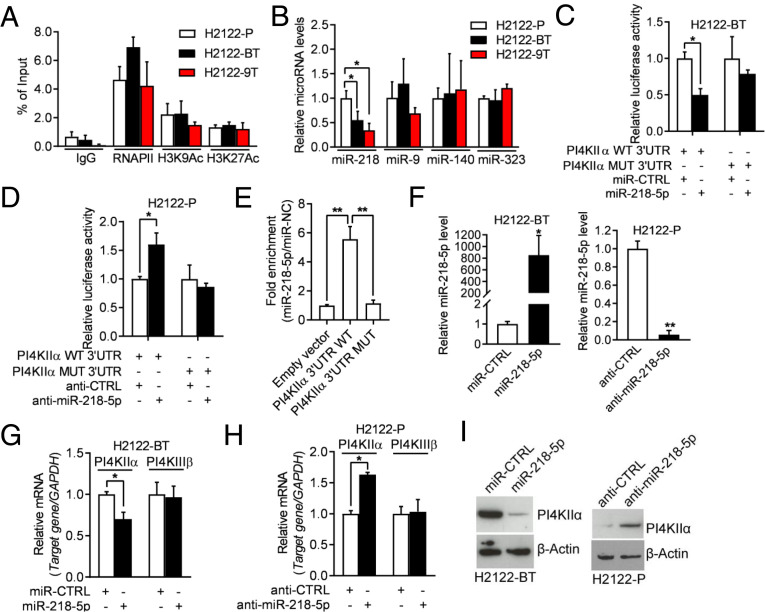
Fig. 4.
miR-218-5p negatively regulates PI4KIIα expression. (A) ChIP was conducted to evaluate the enrichment of RNA polymerase II and active histone marks (H3K9Ac and H3K27Ac) on the PI4K2A gene promoter. (B) qPCR analysis of miRNAs. Values were normalized to H2122-P. (C) Luciferase activity in H2122-BT cells cotransfected with PI4KIIα 3′-UTR reporters and miRNA mimics. Values were normalized to control miRNA mimics (miR-CTRL). (D) Luciferase activity in H2122-P cells cotransfected with PI4KIIα 3′-UTR reporters and antagomirs. Values were normalized to control antagomir (anti-CTRL). (E) Quantification of miR-218-5p levels by AGO-CLIP assays on wild-type (WT) or mutant (MUT) PI4KIIα 3′UTRs in H2122 cells. Values were normalized to empty vector control. (F) qPCR analysis of miR-218-5p levels in H2122-BT cells transfected with miR-218-5p or miR-CTRL (left bar graph) and H2122-P cells transfected with miR-218-5p antagomir (anti–miR-218-5p) or anti-CTRL (right bar graph). (G and H) qPCR analysis of PI4KIIα mRNA levels in cells transfected with miR-218-5p mimics or antagomirs. A gene that lacks predicted miR-218-5p binding sites (PI4KIIIβ) was included as a negative control. Values were normalized to miR-CTRL or anti-CTRL. (I) WB analysis of PI4KIIα in cells described in G and H. β-Actin served as loading control. Data are shown as mean ± SEM of triplicate biological replicates. P values: one-way ANOVA in A, B, and E and two-sided t test in all others.*P < 0.05 and **P < 0.01.

