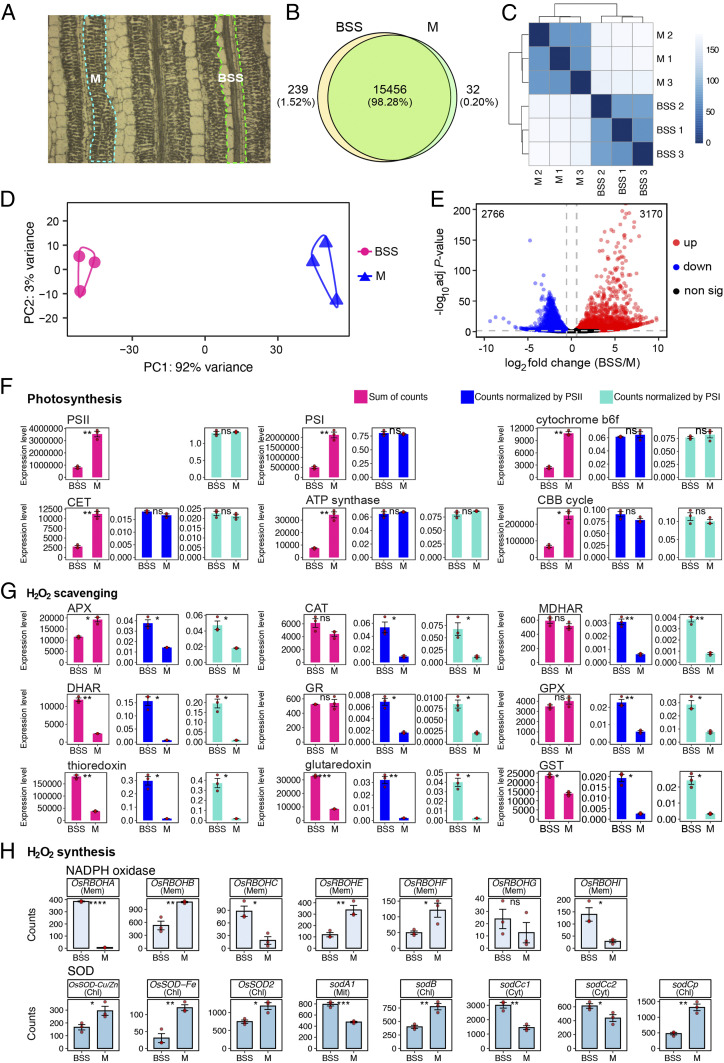
Fig. 3.
Global analysis mRNA from BSS and M cells indicate a balanced accumulation of transcripts encoding components of the photosynthetic electron-transport chain and the Calvin–Benson–Bassham cycle but that BSS may have greater capacity to synthesize reactive oxygen species. (A) BSS and M cells were sampled for RNA using LCM. (B) Pie chart summarizing the number of genes expressed in both BSS and M cells. (C) Hierarchical dendrogram and (D) Principal component analysis indicate that the most variance was associated with tissue type. (E) Volcano plot showing the number of differentially expressed genes between BSS and M. (F–H) Abundance of photosynthesis (F), H2O2 scavenging (G), and H2O2 synthesis (H) transcripts. For photosynthesis complexes, the sum of all components of each complex is presented, and, to take into account lower chloroplast content in BSS, these were normalized to either Photosystem I or II. Predicted subcellular localization of each NADPH oxidase (RBOH) and superoxide dismutase (SOD) isoform is annotated (chl = chloroplast, mem = plasma membrane, mit = mitochondrial, cyt = cytoplasm). The t tests indicate statistically significant differences (****P < 0.0001, ***P < 0.001, **P < 0.01, *P < 0.05).

