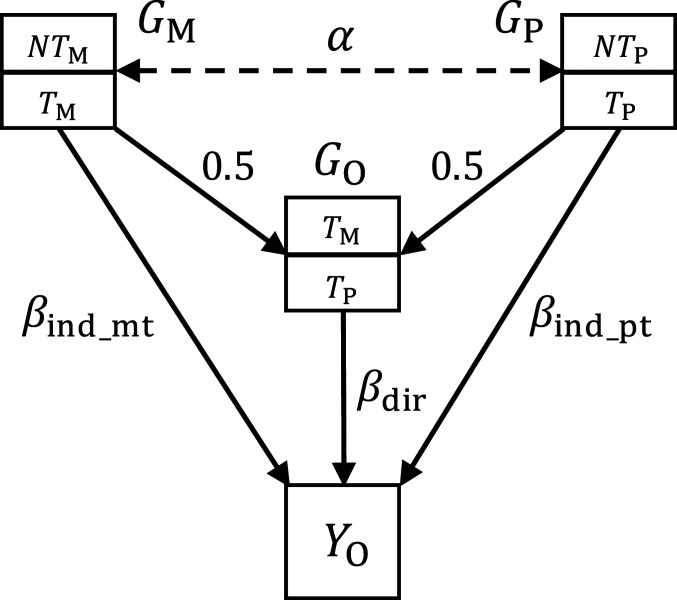
Fig. 1.
Schematic diagram of direct and indirect genetic effects. represents the maternal, paternal, and offspring genotypes, respectively. is the correlation between spousal genotypes at a locus. Effect size 0.5 is due to the fact that half of the parent’s genome is randomly transmitted to the offspring . is the offspring’s phenotype. and represent transmitted and nontransmitted alleles from a parent to the offspring. In general, both offspring and parental genotypes could affect the offspring’s phenotype with effect sizes of and , respectively.

