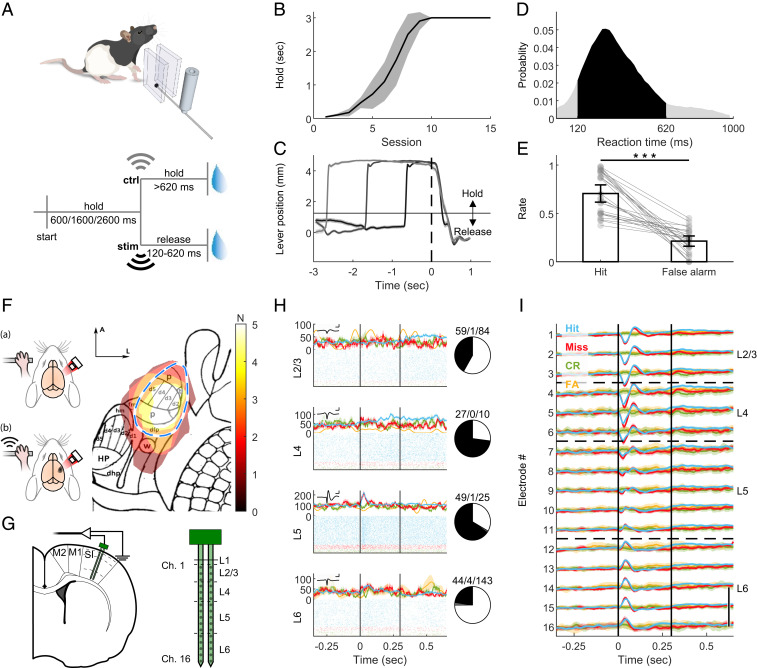
Fig. 1.
Rats detect forepaw vibration. (A, Upper) Simplified illustration of the behavioral setup. A lever was enclosed between two walls and could be moved on the horizontal dimension. Piezo actuator clamped to the lever conveyed the vibrotactile stimulus. For more details, see SI Appendix, Fig. S1. (A, Lower) Task design. To start a trial, the freely moving rats had to pull the lever in their preferred direction and hold it for one of three pseudorandom durations. Upon vibration (stim), the rats had to release the lever within 120 to 620 ms to gain a sucrose water reward. In 20% of the trials, an actuator located in the chamber but clamped to a lever out of the rat’s reach was activated (ctrl). The rat had to keep holding for longer than 620 ms in order to gain a reward. (B) Holding training progress. Mean ± 95% CI of the holding duration of five rats. Rats had to hold the lever passed the threshold position for at least the holding time to obtain a reward. (C) Rats learned to hold the lever steadily and respond to the cue. Mean ± 95% CI of the lever position (measured by the angle encoder) at “hit” trials. Time t = 0 indicates the stimulus onset. Horizontal line at ∼1 mm indicates the hold/release threshold. Trials with holding time = 600 ms are indicated in black, 1,600 ms in gray, and 2,600 ms in light gray. (D) Histogram of reaction (release) times in stim trials. Vibration was presented from t = 0 to t = 300 ms. Black area: RTs within the allowed response window. Gray: RTs of early or late release trials. n = 25 sessions from five rats. (E) Hit rate: Ratio of trials with lever release within <620 ms after real stimulus onset, from all vibration trials. False alarm rate: Ratio of responded trials within <620 ms after control actuator onset from all control trials. Bars indicate the mean and error bars the 95% CI. Gray circles and lines show individual sessions. ***z = 5.977, P = 2.28 × 10⁻⁹, Wilcoxon rank sum test. (F) Intrinsic signal imaging. (Left) Schematic illustration of procedure. (A) The brains of lightly anesthetized rats were imaged through the thinned skull under 855 nm illumination. Upon vibrotactile stimulation of the forepaw (B), responsive cortex absorbed more light compared to blank trials. See Materials and Methods for details. (Right) Responsive areas of five rats overlaid on projected published somatotopic map (26). N (color bar) indicates number of rats. Blue dashed line: assumed SI forepaw location based on map. p, palm; t, thumb (pollux); d1 to 5, digits; dfp, dorsal forepaw; fm, forelimb muscle; hm, hindlimb muscle; w, wrist whiskers; dhp, dorsal hindpaw; HP, hindpaw; (Scale bar: 1 mm.) A, anterior; L, lateral. (G, Left) Schematic illustration of implantation locations of the 2-shank, 32-channel probe. SI: primary forelimb somatosensory cortex. M1: primary motor. M2: secondary motor. Dashed lines: estimated borders between cortical layers. (G, Right) Magnified illustration of the probe, indicating the location of channel relative to surface and tip and estimated borders between cortical layers as shown in H and I. (H, Left) Peristimulus time histogram (PSTH, Top) and raster plots (Bottom) of representative single units in layers 2/3, 4, 5, and 6. Blue: hit. Red: miss. Green: CR. Yellow: FA. Inset: averaged waveform of the unit. (Scale bar: 1 ms/250 μV.) (H, Right) Number of positively modulated (black), negatively modulated (gray) and nonmodulated (white) single units. (I) Mean ± 95% CI of the LFP color coded as in H. Vertical black lines indicate stimulus onset and offset (t = 0 to 0.3 s). (Scale bar: 200 μV.) CR; correct rejection. FA; false alarm. See also SI Appendix, Figs. S1, S2, S8, and S9.

