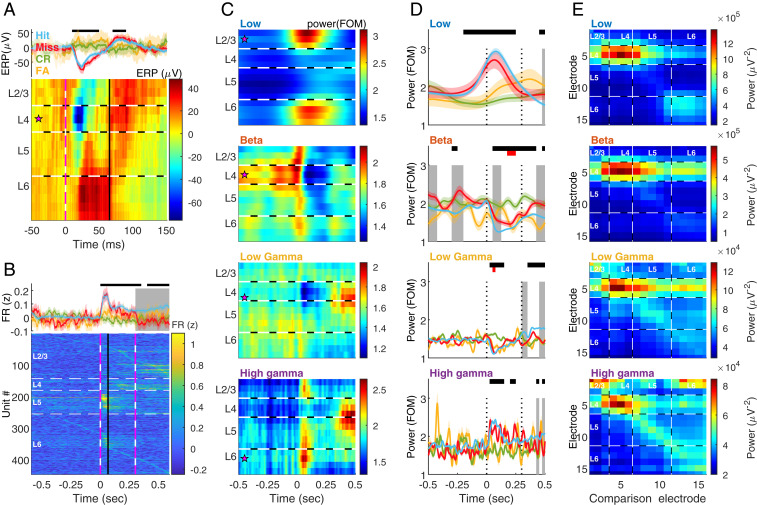
Fig. 2.
Band and layer differences in detection. (A) ERP, calculated as the mean of raw LFP aligned to stimulus onset (time t = 0). (A, Upper) Mean ± 95% CI on electrode 5 (located in L4) averaged over hit (blue), miss (red), correct-rejection (CR, green), and false-alarm (FA, yellow) trials. Top black bar indicates significant (P < 0.01) difference between hit and control trials, in ANOVA for repeated measures with Tukey’s critical value for multiple comparisons. Main effect of time: F9, 11637 = 8.5, P = 3.6 × 10⁻³, time × behavior: F27, 11637 = 8.18, P = 2.14 × 10⁻⁵. (A, Lower) The ERP on each electrode at hit trials. Magenta star: the electrode used in the Upper panel. Horizontal black and white dashed lines indicate the estimated borders between layers. Vertical pink and white dashed line designates stimulus onset (t = 0). Vertical black line denotes phase transition from de- to hyperpolarization in L4 at hit trials (blue trace in Upper passes 0 after the trough, t = 0.065). n = 10 sessions from five rats. (B, Upper) mean ± 95% CI of the z-normalized FR of all units (n = 447 units from five rats), color coded as in A. Piezo activation started at t = 0 and lasted 0.3. Top black bar indicates significant (P < 0.01) difference between hit and control trials, in ANOVA for repeated measures with Tukey’s critical value for multiple comparisons. Gray background indicates a significant (P < 0.01) difference between hit and miss. Main effect of time: F40, 53520 = 25.6, P = 1.14 × 10−186, time × behavior: F80, 53520 = 9.47 P = 2.03 × 10−82. (B, Lower) FR during hit trials. Units are sorted according to layer and timing of maximal FR. Horizontal white dashed lines indicate the estimated borders between layers. Vertical pink and white dashed lines designate stimulus onset (t = 0) and offset (t = 0.3). Vertical black line denotes t = 0.065, is as in A. At time t = 0 to t = 0.065 s (depolarization phase of the ERP at L4) the FR in L5 was significantly higher at hit and miss trials compared to CR and FA (P < 10−6, two-way ANOVA with Tukey’s post hoc). There were no differences between hit and miss trials (P = 1.0 in all layers). The FR in L5 was significantly (P < 3.77 × 10⁻⁹) higher than in all other layers. (C) Induced power spectrograms of hit trials, computed by transforming the LFP to the frequency domain using Morlet wavelets, normalizing to the median per frequency and averaging over hit trials. Low: 3 to 10 Hz. Beta: 15 to 30 Hz. Low gamma: 40 to 90 Hz. High gamma: 95 to 120 Hz. Magenta star: most modulated channel used in D. FOM, fraction of the median. (D) Comparison of the power dynamics of each band in the different behavioral categories. Behavioral color coding (hit, miss, CR, and FA), black bars and gray background are the same as in B. Red bars indicate difference between CR and FA. Main effect for intersection time × behavior: low: F117, 43797 = 9.38, P = 1.93 × 10⁻¹¹; beta: F117, 43797 = 2.03, P = 9.3 × 10⁻⁴; low gamma: F117, 43797 = 2.57, P = 7.56 × 10⁻¹²; high gamma: F117, 43797 = 1.57, P = 4.2 × 10⁻⁴. Differences between hit and miss trials prior to and during stimulus (0 to 0.3 s, dotted black lines) were observed only in beta. (E) Localization of ongoing bursts in all bands and using each electrode for comparison. Mean of the maximal power detected on each electrode (ordinate) during bursts in each band, as a function of the electrode used for burst detection (comparison electrode, abscissa). Note that in all bands the strongest localization was at L4 (electrodes 4 to 6). Low frequencies were localized also in deep layers (Bottom Right corner, electrodes 11 to 15). Low and high gamma exhibited local synchronization (increased power on the diagonal). In addition, high gamma showed strong synchronization in superficial layers (electrodes 1 to 3). Dashed white lines: estimated borders between cortical layers. See also SI Appendix, Figs. S2–S5 and S9.

