Fig. 3.
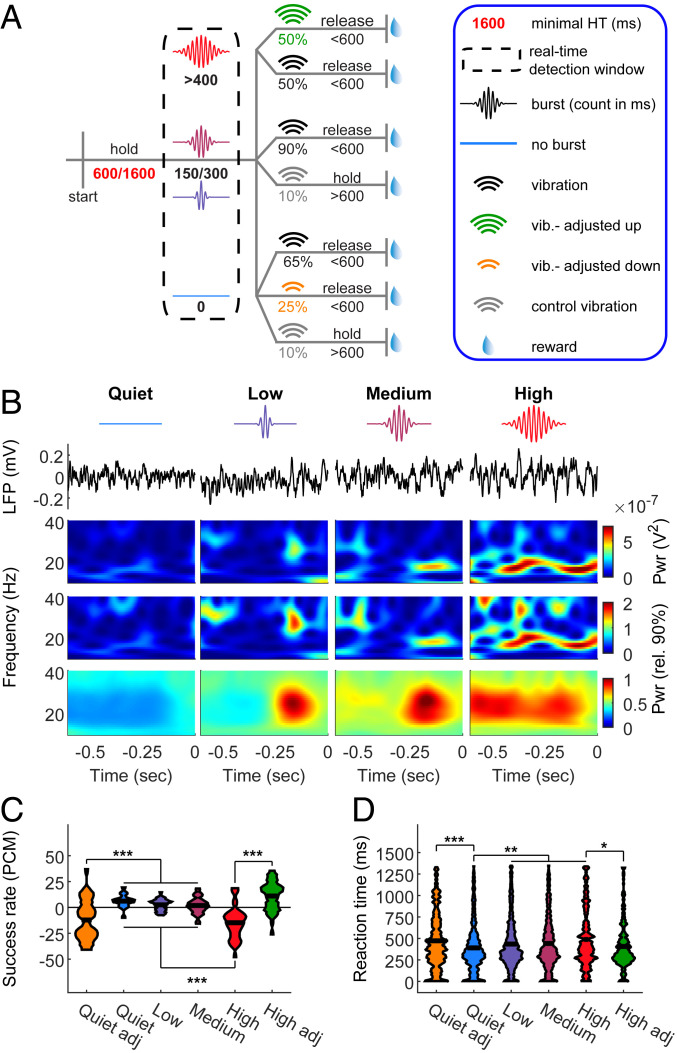
Real-time impact of beta on detection. (A) Task design. Beta-bursts were detected in real time. A near-threshold stimulus was given upon detection of exactly 0 (quiet), 150 (low), 300 (medium), or more than 400 (high) burst samples during the detection window and the 600 ms preceding it. For adjustments, in a subset of “high” trials the stimulus amplitude was increased by 2 μm, and in a subset of “quiet” trials it was reduced by 2 μm. (B) Intrinsic brain signal triggered stimulation. First line: reference to trial types as appeared in A. Second line: raw LFP examples of one trial per condition. Third line: the power spectra of the trials in the second line. Fourth line: power spectra normalized to the 90th percentile. Note that while qualitatively similar, the normalized spectra represent higher frequencies stronger than the nonnormalized spectra. Lower line: average of all trials. Stimulus onset was at time t = 0. (C and D) Effect of stimulus locking to intrinsic brain signal and amplitude adjustment on success rate (presented as PCM, (C) and RT (D). The widths of the shapes in C indicate the distribution of sessions (n = 35 from five rats), and in D the distribution of trials (N = 458, 1,264, 1,192, 945, 281, and 262 for quiet adjusted, quiet, low, medium, high, and high adjusted, respectively). Black horizontal lines indicate the mean. Main effects: (C) F5, 204 = 23.06, P = 2.49 × 10−48; (D) F5, 4396 = 9.29, P = 8.18 × 10⁻⁹. *P < 0.05, **P < 0.01, ***P < 0.001, ANOVA with Tukey’s critical value for multiple comparisons. See also SI Appendix, Fig. S6.

