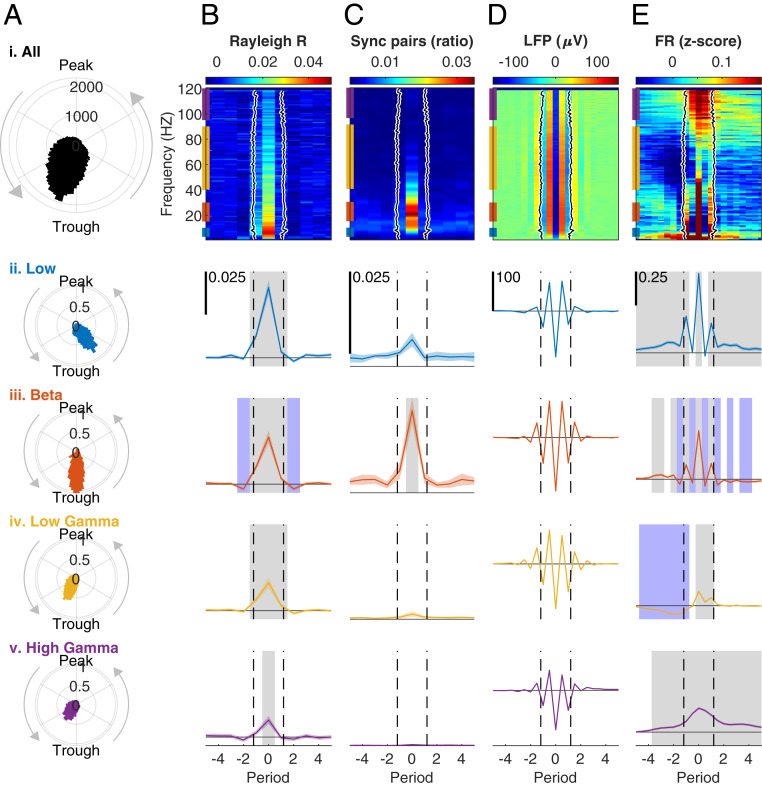
Fig. 4.
Bursts indicate transient synchrony of flexible cell assemblies. (A) Phase locking of single units to the LFP. (i) Histogram of the mean LFP phase at spike times of each unit during bursts in each frequency from 1 to 120 Hz. Mean angle (M) = 150.4 (trough at 180). Resultant vector length (Rayleigh’s R) = 0.497. Rayleigh test for nonuniformity of circular data z = 15,767, P = 0. (ii to v) Probability density function (PDF) histograms of the mean phase at spike times of each unit during bursts at each frequency band. (ii) Low frequencies (3 to 10 Hz), M = 213.02, R = 0.715, z = 2,180.7, P = 0. (iii) Beta (15 to 30 Hz), M = 187.65, R = 0.795, z = 3,922.5, P = 0. (iv) Low gamma (45 to 90 Hz), M = 138.75, R = 0.556, z = 8,409.6, P = 0. (v) High gamma (95 to 120 Hz), M = 129.41, R = 0.445, z = 2,745.1, P = 0. Band color code corresponds to the bars on the Left edge of the colormaps in B–E, i. (B) Mean resultant vector length (Rayleigh’s R). To facilitate the comparison between different frequencies, the time axis was converted into periods in each frequency. Period 0 indicates the nearest trough to the timepoint with burst power maximum. (i) Colormap computed for each unit in each period of all bursts in each of the frequencies 1 to 120 Hz, normalized to baseline (mean of periods −10 to −7) and averaged over units. Black line: the mean burst duration in each frequency, defined as the time interval around a peak in which the power exceeded the 90th percentile. Black shading indicates the 95% CI (calculated over bursts, total n = 332,401, 2,817 ± 81.43 [mean ± 95% CI] per frequency) and is too small to be seen. (ii to v). Mean ± 95% CI of the mean R averaged over frequencies in each band. Gray and blue shading in ii to v indicate period bins with a significant (P < 0.05) increase or decrease, respectively, in a repeated-measures ANOVA with Tukey’s adjustment for multiple post hoc comparisons compared to baseline. Dashed black lines indicate mean burst duration in the band. The horizontal line indicates zero. Scale bar appears in the Top Left corner of ii and is identical in iii to v. Main effects: (ii) F20, 9060 = 27.48, P = 2.45 × 10⁻⁷. (iii) F20, 9060 = 25.32, P = 7.0 × 10⁻⁷. (iv) F20, 9060 = 22.33, P = 3.06 × 10⁻⁶. (v) F20, 9060 = 7.66, P = 0.0059. (C) The ratio of synchronized unit pairs from all possible pairs in each session (n = 861.7 ± 378.25, mean ± 95% CI pairs per session), calculated separately for each period in each frequency. A pair was defined synchronized if the spike trains were significantly (P < 0.05) interdependent after correction for nonstationarity, using the algorithm proposed in ref. 46. The black line in i and dashed black lines in ii to v indicate burst duration as in B. In all bands (ii to v) the highest value was at period 0, but only in beta it was higher than baseline in the post hoc test and there was a significant main effect in the repeated-measures ANOVA. (ii) F20, 160 = 1.39, P = 0.27. (iii) F20, 160 = 12.32, P = 0.008. (iv) F20, 160 = 1.14, P = 0.32. (v) F20, 160 = 2.20, P = 0.18. (D) Mean LFP around bursts. (i) Colormap of all frequencies. To allow differentiation between peaks and troughs the time resolution was increased to half periods. The black line indicates mean burst duration as in B. (ii to v) Mean ± 95% CI of the LFP averaged over the frequencies of each frequency band. Dashed black lines indicate mean burst duration in the band as in B. (ii) n = 16,124 bursts. (iii) n = 47,512. (iv) n = 123,164. (v) n = 77,215. (E) Normalized population FR computed by summing the spikes from all units recorded in a session (n = 44.7 ± 8.36) at each timepoint, converting into FR by convolution with a 25-ms long, 0.34-ms standard deviation Gaussian, normalizing (z score), subtracting the baseline defined as the mean in periods −10 to −7 and averaging over bursts. (i) Black line as in B. (ii to v) Mean ± 95% CI of the population FR averaged over the frequencies of each frequency band. Gray and blue significance shading and dashed black line as in B. Main effects: (ii) F40, 644160 = 54.22, P = 1.88 × 10⁻¹³. (iii) F40, 1900240 = 40.67, P = 1.82 × 10⁻¹⁰. (iv) F40, 5534960 = 38.11, P = 6.72 × 10⁻¹⁰. (v) F40, 3087800 = 49.64, P = 1.86 × 10⁻¹². See also SI Appendix, Fig. S7.

