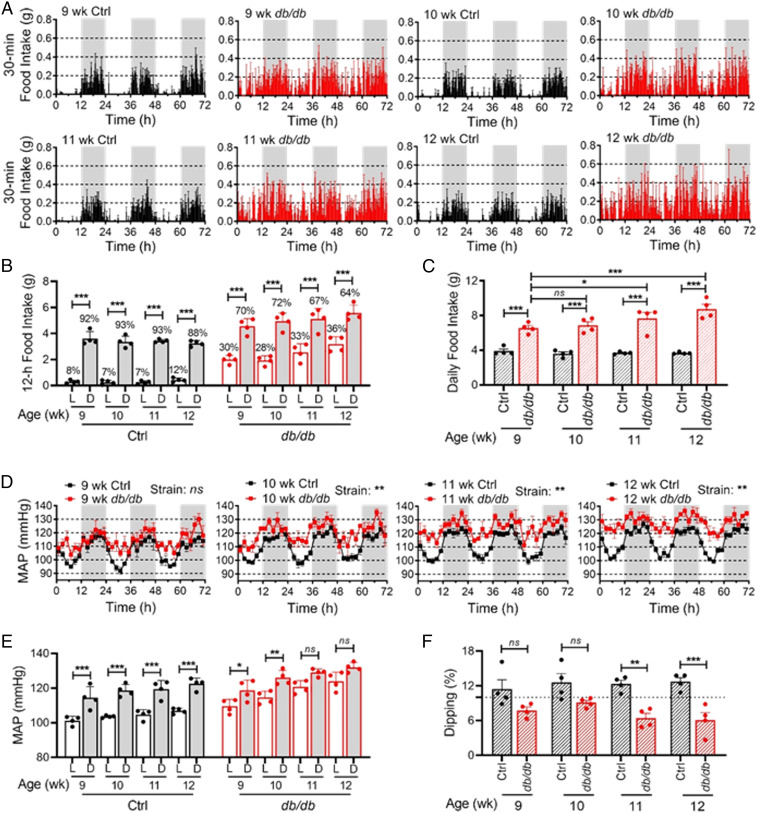
Fig. 1.
Time course of the food intake diurnal rhythm and BP circadian rhythm in db/db and control mice. Food intake and BP were recorded by BioDAQ and telemetry in the same 9-, 10-, 11-, and 12-wk-old diabetic db/db mice and age-matched nondiabetic control mice (db/+). Four mice are in each group. (A) Daily profiles of food intake in 30-min intervals over 72 h (h) during the light (L) and dark (D) phases, shown in white and gray, respectively. (B) The 12-h food intake during the light and dark phases. Percent of daily food intakes are indicated above each bar. (C) Daily food intake. (D) Daily profiles of MAP over 72 h in 2-h intervals during the light and dark phases. (E) The 12-h average MAP during the light and dark phases. (F) MAP dipping was calculated as percentage of MAP decrease during the light phase compared to the dark phase. The dashed line indicates a 10% dipping. The data were analyzed by two-way ANOVA (C, D, and F) and three-way ANOVA (B and E) with multiple comparisons test and were expressed as the mean ± SE (SEM). *P < 0.05; **P < 0.01; ***P < 0.001; ns, not significant.

