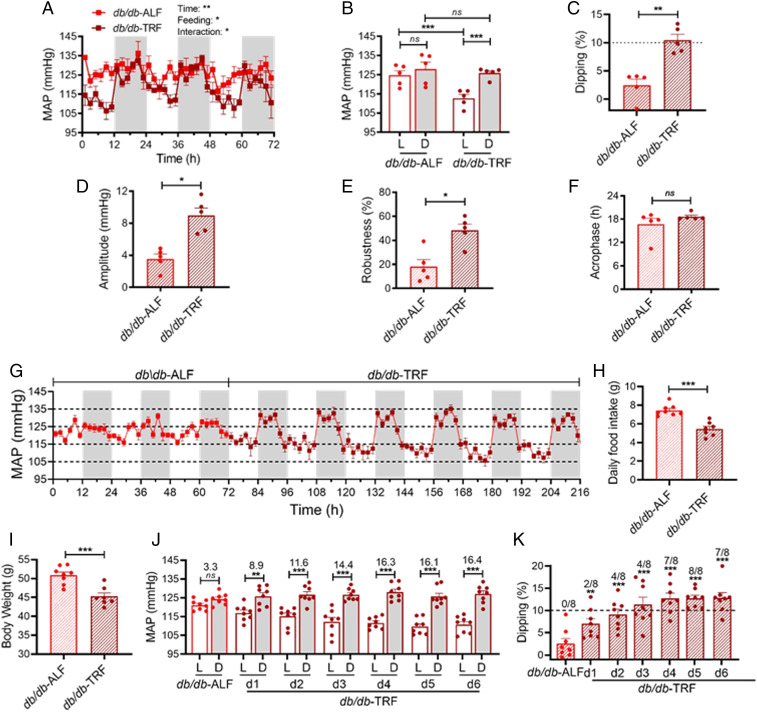
Fig. 3.
TRF restores BP dipping in nondipping db/db mice. BP was monitored by telemetry. In A–F, MAP was first recorded for 3 d in the 15-week-old db/db mice (n = 5) under ALF and then another 3 d after 9 d of 8-h TRF. (A) Daily profiles of the MAP in 2-h intervals over 72 h during the light and dark phases, shown in white and gray, respectively. (B) The 12-h average MAP during the light (L) and dark (D) phase. (C) MAP dipping. The dashed line indicates 10% dipping. (D–F) Amplitude (D), robustness (E), and acrophase (F) of MAP circadian rhythm. In G–K, MAP was continuously recorded in the 16-week-old db/db mice (n = 8) under ALF for 3 d and then under TRF for 6 d. (G) Daily profiles of the MAP in 2-h intervals over 216 h during the light and dark phases, shown in white and gray, respectively. (H and I) Daily food intake (H) and body weight (I) were measured 8 and 9 d after ALF or TRF, respectively. (J) The 12-h average MAP during the light (L) and dark (D) phase. The difference in MAP between the light and dark phases are indicated above the bars. (K) MAP dipping. The dashed line indicates 10% dipping. The number of mice with ≥ 10% dipping are indicated above each bar. The data were analyzed by two-way ANOVA with multiple comparisons test (A and B), t test (C–F; H and I), and one-way ANOVA (K), and were expressed as the mean ± standard error (SEM). *P < 0.05; **P < 0.01; ***P < 0.001; ns, not significant.

