Fig. 2.
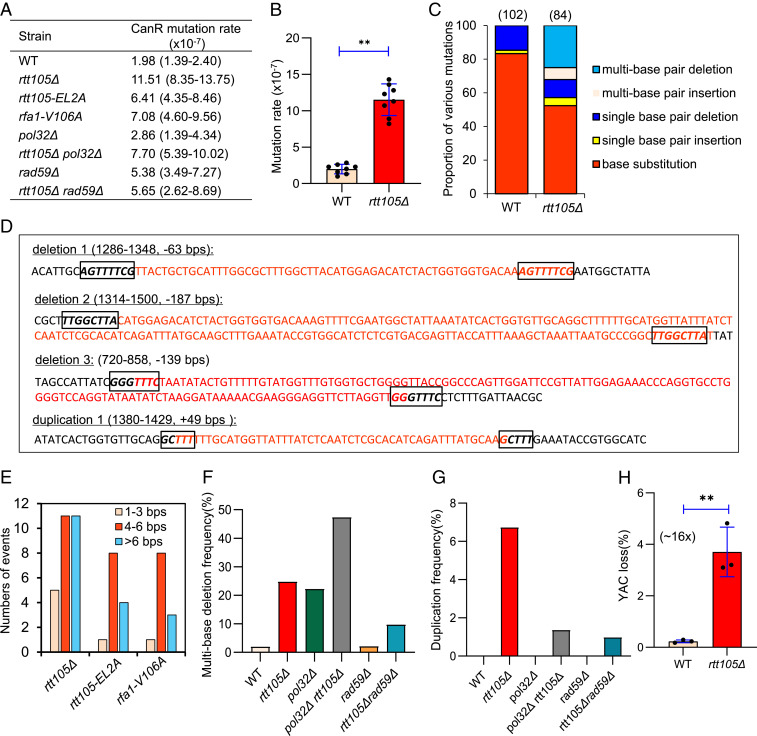
Rtt105 promotes high-fidelity replication and suppresses chromosome loss. (A) Table listing the mutation rates for indicated strains. The values in the brackets represent 95% CIs. (B) Plots showing the rate of spontaneous mutations in the WT and rtt105Δ cells. (C) Graph showing the proportion of each category of mutation in CanR colonies derived from indicated cells. The number of CanR colonies sequenced for each strain is indicated. The statistical comparison of different mutation patterns between the WT and rtt105Δ cells in C was performed with χ2 test. P < 0.01. (D) Examples of large deletions or duplications observed in rtt105Δ cells. The deleted or duplicated DNA sequences are marked in red color. The boxed sequences in italics denote microhomologies. (E) Numbers of deletion or duplication events with indicated lengths of microhomologies in indicated cells. (F and G) Plots showing the frequency of large deletions and duplications, respectively, in indicated strains. (H) The frequency of YAC loss in the WT and mutant cells. The error bars in B and H represent SD from at least three independent experiments. **P < 0.01 (Student’s t test).

