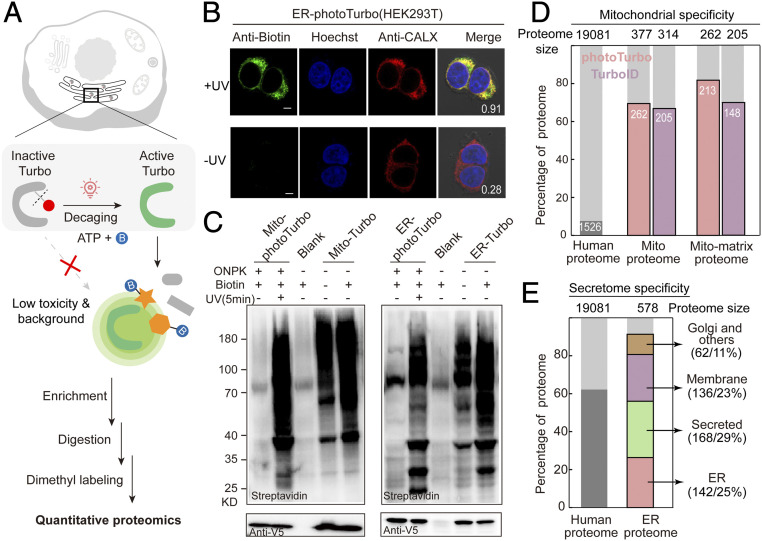
Fig. 2.
Engineering bioorthogonally activatable PL enzymes for SubMAPP. (A) Schematic description of photoTurbo-enabled subcellular proteomics. The light-activated photoTurbo allowed temporally gated and spatially restricted protein biotinylation that can be analyzed by MS-based quantitative proteomics. (B) Fluorescence images of HEK293T cells expressing photoTurbo in the ER lumen, with proteins biotinylated by UV illumination for 5 min. CALX: ER marker. (Scale bars: 5 µm.) Pearson's R values are shown in the corner. (C) Western blot analysis comparing the proximity-dependent protein labeling efficiency of photoTurbo with wild-type Turbo in mitochondrial matrix and endoplasmic reticulum. Cells transfected with empty vector were used as “Blank” sample. (D) MS-based identification and quantification of mitochondrial matrix proteome labeled by photoTurbo and TurboID, respectively. From left to right: the first column shows the fraction of annotated mitochondrial proteins in entire human proteome; the second and third columns compare the fractions of mitochondrial proteins in the data sets; and the fourth and fifth columns represent the fractions of mitochondrial matrix proteins in the data sets. (E) Specificity analysis of ER lumen proteome obtained via photoTurbo, with the coverage of secretion related proteins reaching 88% (508 out of 578 proteins).

