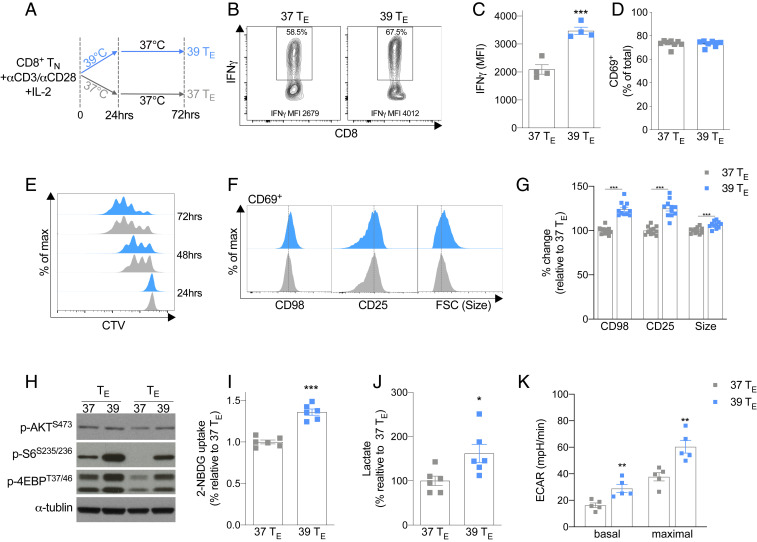
Fig. 1.
Exposure to 39 °C during activation promotes CD8+ TE cell function and anabolic metabolism. (A) Naïve CD8+ T cells were activated with anti-CD3/CD28 at 37 or 39 °C for 24 h and then subsequently cultured at 37 °C. (B and C) Representative histogram and bar graph of mean fluorescent intensity (MFI) of IFN-γ production assessed 72 h postactivation. (D) Percent of CD69+ cells 24 h after activation. (E) Representative histogram of proliferation as assessed by CellTrace Violet (CTV) 24 to 72 h after activation. (F and G) Representative histogram and bar graphs of the MFI of CD69+ cells, surface-expressed CD25 and CD98, and forward scatter (FSC) cell size 24 h postactivation. (H) Representative Western blots of two biological replicates showing phosphorylated (p) AKT, S6, and 4E-BP1 24 h postactivation. (I) Potential glucose uptake measured by 2-NBDG uptake 24 h postactivation. (J) Lactate production 24 h postactivation. (K) ECAR measured at baseline and at the maximal rate following addition of rotenone and antimycin. n ≥ 3 biological replicates/group as indicated by individual data points and shown as mean ± SEM (except for the Western blots, n = 2). *P < 0.05, **P < 0.01, ***P < 0.001.

