Fig. 4.
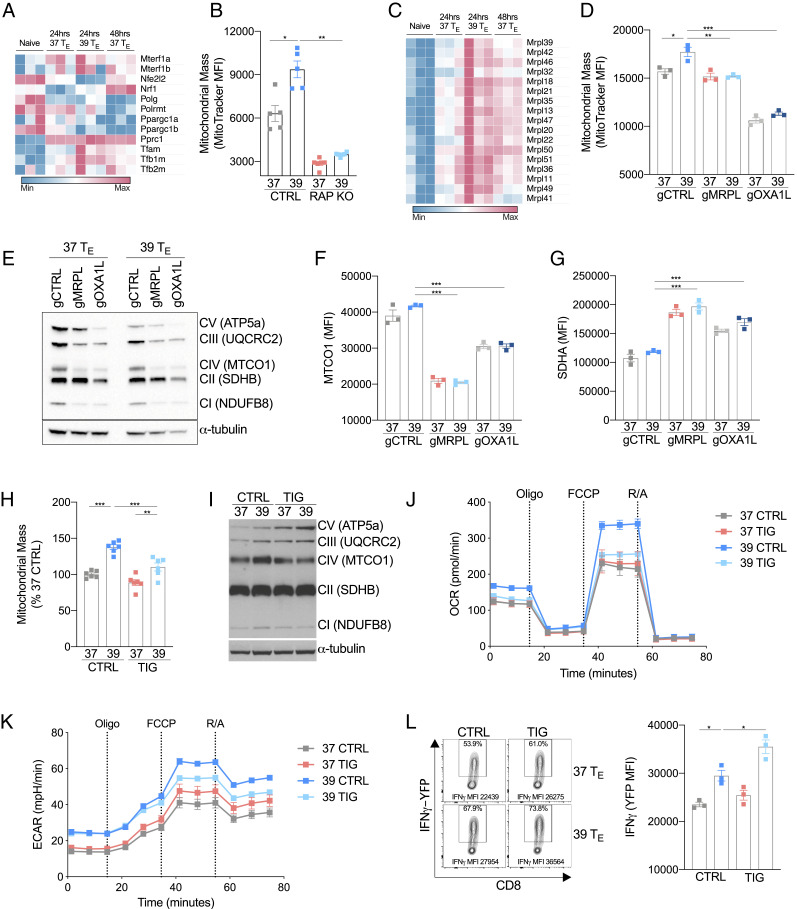
Mitochondrial translation is enhanced by febrile temperature. (A) Heatmap showing mRNA expression of genes associated with mitochondrial biogenesis in naïve or activated CD8+ T cells. (B) MFI of MitoTracker Green 24 h postactivation in wild-type (CTRL) and RAPTOR-deficient (RAP KO) CD8+ T cells. (C) Heatmap showing mRNA expression of a selection of genes that encode mitochondrial ribosomal proteins (MRPL) in naïve or activated CD8+ T cells. (D) MFI of MitoTracker Green of CD8+ T cells targeted with CRISPR/Cas9 guides against MRPL39 (gMRPL), OXA1L (gOXA1L), or a nontargeting control (gCTRL) 24 h postactivation. (E) Western blot of mitochondrial respiratory components and (F and G) flow cytometry analysis of MTCO1 and SDHA in cells targeted with CRISPR/Cas9 guides against MRPL39 (gMRPL), OXA1L (gOXA1L), or a nontargeting control (gCTRL) 24 h postactivation. (H) Cells were treated with TIG (a mitochondrial-specific translation inhibitor) or CTRL during activation, and MitoTracker Green was measured 24 h postactivation. (I) Representative Western blot of mitochondrial respiratory components in CTRL- or TIG-treated groups. (J and K) OCR and ECAR at baseline and following administration of oligomycin (oligo), fluoro-carbonyl cyanide phenylhydrazone (FCCP), and rotenone and antimycin (R/A) of T cells 24 h after activation grouped from three replicates per condition. (L) Representative histogram and bar graph showing mean fluorescent expression (MFI) of IFN-γ production measured as expression of IFN-γ-YFP in CD8+ cells isolated from IFN-γ reporter (GREAT) mice and assessed 72 h postactivation. n ≥ 3 biological replicates/group as indicated by individual data points and shown as mean ± SEM (except E, n = 1). *P < 0.05, **P < 0.01, ***P < 0.001.

