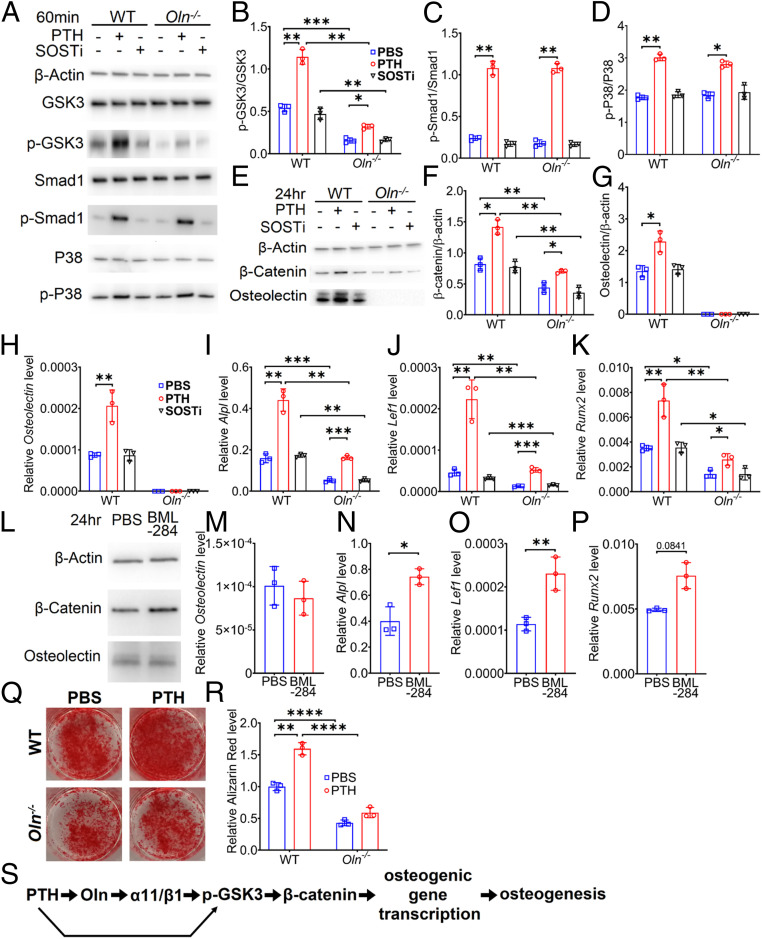
Fig. 4.
Osteolectin deficiency attenuates PTH-induced Wnt signaling. Bone marrow stromal cells cultured from Osteolectin-deficient (Oln−/−) or littermate control (WT) mice were treated with PTH (10 nM), SOSTi (10 ng/mL), or PBS (control) in osteogenic differentiation medium. (A–D) Bone marrow stromal cells were lysed 60 min after treatment and immunoblotted for β-actin, GSK3, phospho-GSK3 (p-GSK3), Smad1, phospho-Smad1 (p-Smad1), P38, and phospho-P38 (p-P38) (representative of three independent experiments). (B) Phospho-GSK3 levels normalized to total GSK3 levels. (C) Phospho-Smad1 levels normalized to total Smad1 levels. (D) Phospho-P38 levels normalized to total P38 levels. (E–G) Bone marrow stromal cells were lysed 24 h after treatment and immunoblotted for β-actin, β-catenin, and osteolectin (representative of three independent experiments). (F) β-Catenin levels normalized to β-actin levels. (G) Osteolectin levels normalized to β-actin levels. (H–K) Bone marrow stromal cells were lysed 3 d after treatment and analyzed by qRT-PCR to assess Osteolectin (H) and Wnt target gene transcript levels including Alpl (I), Lef1 (J), and Runx2 (K). (L–P) Control bone marrow stromal cells cultured in osteogenic differentiation medium were treated with PBS or BML-284, a Wnt agonist, then lysed 24 h later and immunoblotted for β-actin, β-catenin, and osteolectin (L) or analyzed 3 d later by qRT-PCR to assess Osteolectin (M) or Wnt target gene transcript levels including Alpl (N), Lef1 (O), and Runx2 (P) (n = 3 independent experiments). (Q and R) Oln−/− or control bone marrow stromal cells cultured in osteogenic differentiation medium were treated with PTH or PBS for 14 d and stained with Alizarin red S (n = 3 independent experiments). (S) The effect of PTH on Wnt pathway activation and osteogenic differentiation are mediated partly by osteolectin (Oln). All data represent mean ± SD. Statistical significance was assessed using paired sample two-way ANOVAs followed by Dunnett’s (comparing treatments in B–D, F–K, and R), Holm–Sidak’s (comparing genotypes in B–D and F–K) or Sidak’s (M–P and comparing genotypes in R) multiple comparisons tests (*P < 0.05; **P < 0.01; ***P < 0.001; ****P < 0.0001).

