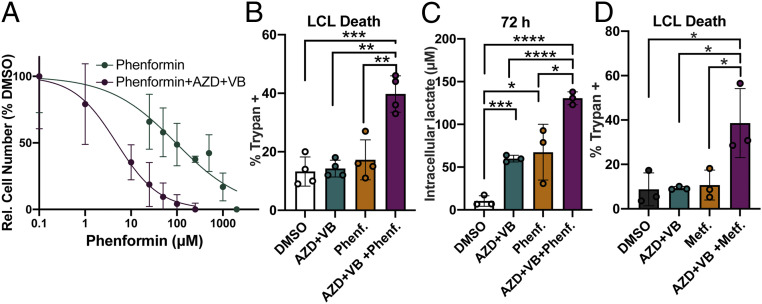
Fig. 6.
MCT1/4 inhibition renders LCLs more susceptible to killing by ETC complex I inhibitors phenformin and metformin. (A) Phenformin IC50 curve generated after 72-h treatment of LCLs (n = 3) with either phenformin or phenformin plus 1 µM AZD3965 and 20 µM VB124. Relative cell number was determined by CellTiter Glo luminescence assay. Relative luminescence values (in relative luciferase units) were normalized to DMSO to obtain %DMSO. (B) LCL death (n = 3) was determined by trypan blue staining after 72 h of treatment with either DMSO, 1 µM AZD3965 + 20 µM VB124 (AZD + VB), 10 µM phenformin (Phenf.), or 1 µM AZD3965 + 20 µM VB124 + 10 µM phenformin (AZD + VB + Phenf.). (C) Intracellular lactate concentration (per 12,500 cells) at 72 h of LCLs treated as in B. (D) LCL death (n = 3) in cells treated with DMSO, 1 µM AZD3965 + 20 µM VB124 (AZD + VB), 2 mM metformin (Metf.), or 1 µM AZD3965 + 20 µM VB124 + 2 mM phenformin (AZD + VB + Metf.), was determined by trypan blue staining after 72 h. All statistical significance was determined by a paired Student’s t test. *P < 0.05, **P < 0.01, ***P < 0.001, and ****P < 0.0001.

