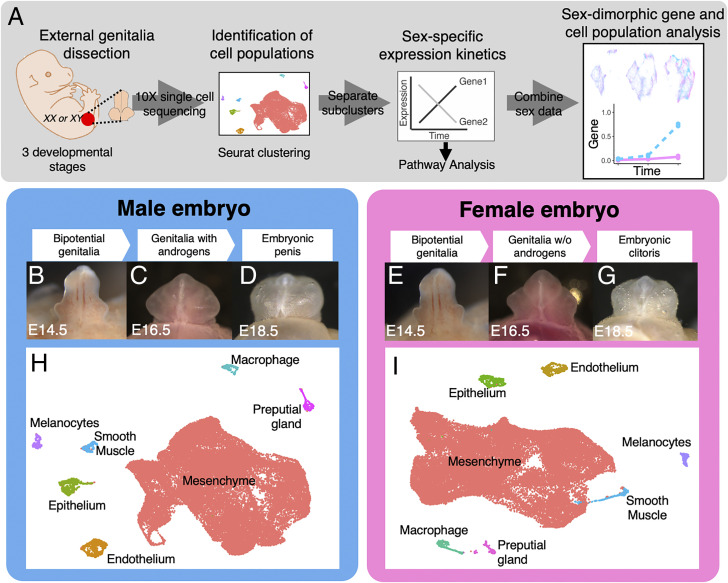
Fig. 1.
Single-cell sequencing analysis of mouse external genitalia. (A) Workflow of single-cell sequencing analysis. (B–G) Whole mount images of male and female external genitalia of mouse embryos at three developmental stages for single-cell sequencing. (H and I) UMAPs of the general cell clusters of male and female samples that are based on all cells from the three developmental stages combined. Each dot represents a single cell, and the color of the cell is the population it belongs to. (J and K) Dot plots of marker genes that are enriched in different cell populations in the male and female genitalia from H and I, respectively. The dot size represents the percentage of cells that express the gene and, the color represents the intensity of expression (red = high and blue = low).

