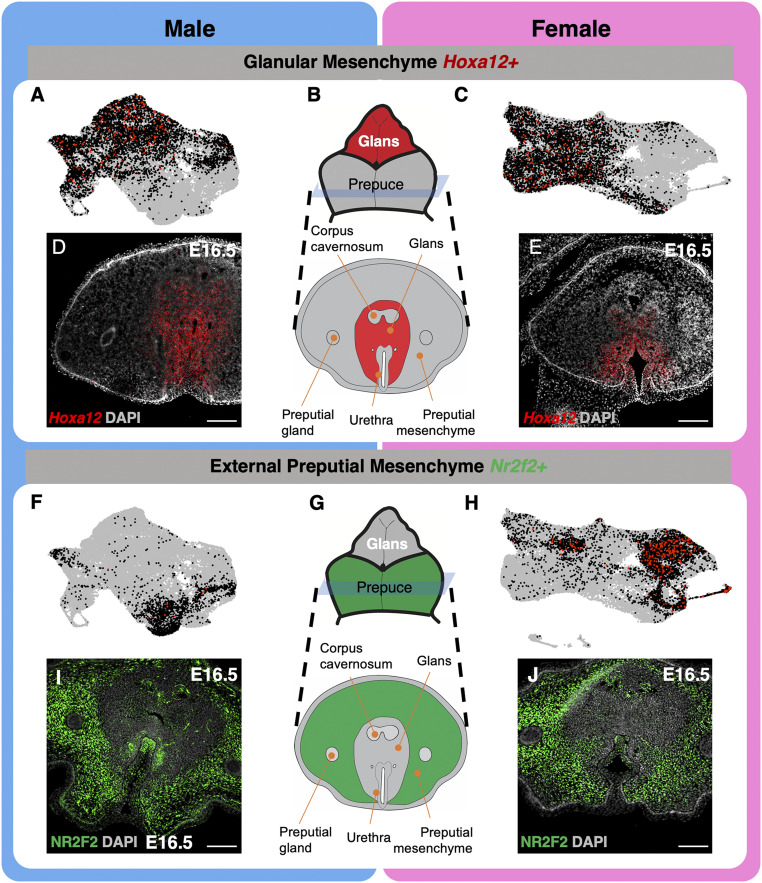
Fig. 2.
Characterization of mesenchymal cell populations identified in single-cell sequencing. (A and C) UMAPs of glanular mesenchyme cell clusters that are positive for Hoxa12 (black and red dots) in male and female external genitalia. Each gray dot represents a cell with no expression of the gene, each black dot represents a cell with modest expression, and each red dot represents a cell with high gene expression. (B) Whole mount and cross-section representation of external genitalia that highlight the glans and glanular mesenchyme in red. (D and E) In situ hybridization of Hoxa12 (red) and DAPI counterstain (gray) on cross-sections of male and female genitalia. (F and H) UMAPs of preputial mesenchyme clusters that are positive for Nr2f2 (black and red dots) in male and female external genitalia. (G) Whole mount and cross-section representation of the external genitalia that highlight the external prepuce and preputial mesenchyme in green. (I and J) Immunofluorescence of NR2F2 (green) and DAPI counterstain (gray) in the external genitalia of the male and female genitalia. (Scale bars, 100 µm.)

