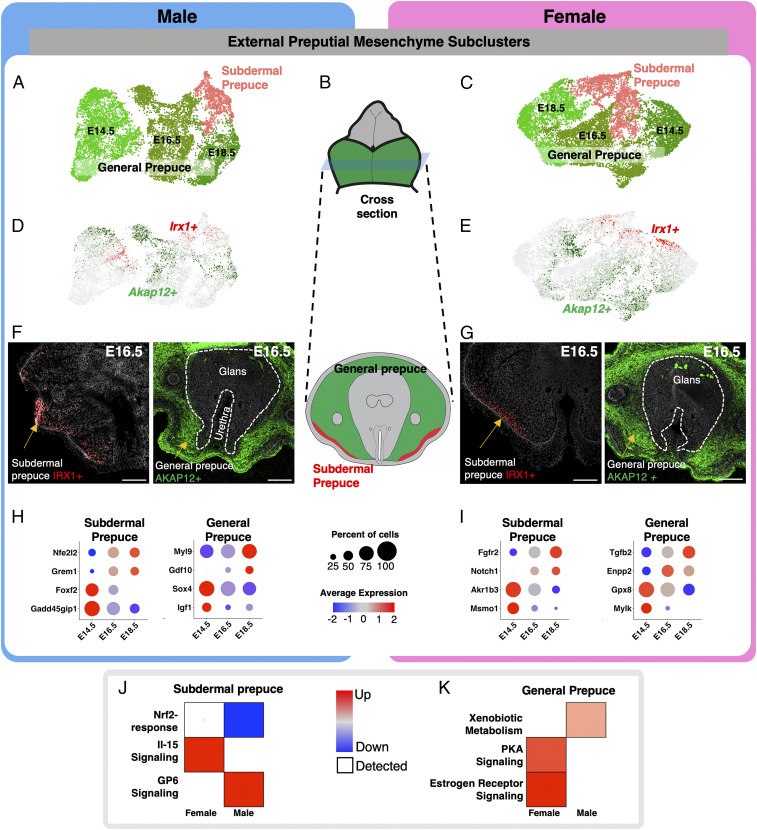
Fig. 4.
Identification of unique subpopulations in the external preputial mesenchyme. (A and C) Reclustering of the preputial mesenchymal cells in male and female from Fig. 2 with higher stringency. The different colored cells represent distinct cell clusters identified with unbiased clustering. (B) Whole mount and cross-section representation of external genitalia that highlight the external prepuce in green and glans in gray. (D and E) UMAPs of preputial mesenchyme subclusters in A and C, respectively, that are positive for Akap12 (green) and Irx1 (red). (F and G) Immunofluoresence for IRX1 (red) and AKAP12 (green) on cross-sections of external genitalia. The external prepuce and urethra portions of the external genitalia are outline with dotted lines and with the glans in the center. (H and I) Dot plots of marker genes that are enriched in different cell populations in the male and female genitalia from A and C, respectively. The dot size represents the percentage of cells that express the gene, and the color represents the intensity of expression (red = high and blue = low). (J and K) Pathway analysis of genes that were identified in H and I. The pathways were selected based on whether they were unique to male or female development. Red = up-regulated, blue = down-regulation, and circle size = significance of the pathway. (Scale bars, 100 µm.)

