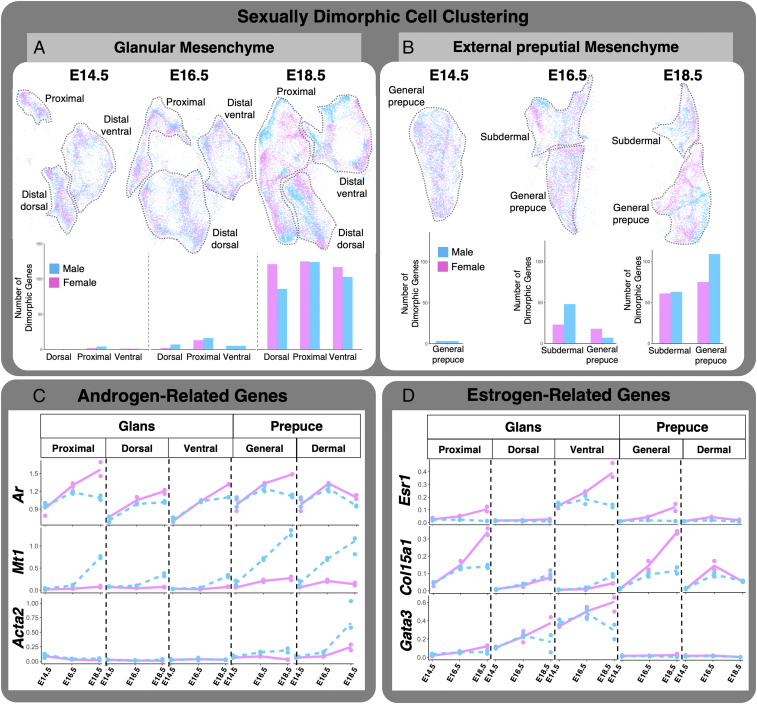
Fig. 5.
Sexual dimorphic expression of androgen- and estrogen-related genes. (A) Glanular and (B) preputial mesenchyme UMAP of both male (blue) and female (pink) data combined. The bar graphs represent sexually dimorphic gene expression identified in each of the cell populations for each developmental time point. (C and D) Transcriptional kinetics of androgen- and estrogen-related genes in each of the identified subpopulations (blue = male and pink = female).

