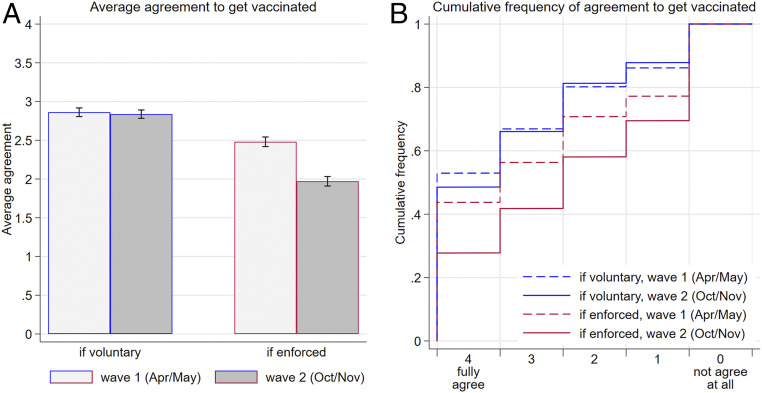
Fig. 1.
Reduced support for enforced vaccination. (A) Average agreement to get vaccinated if it is voluntary or enforced in the two waves of the survey (in Likert scale units). Error bars represent 95% CI. (B) Cumulative distributions of agreement in case of enforced versus voluntary vaccination for the two waves of the survey. For example, the dashed and solid red lines show that 44% and 28% of respondents fully agreed to get vaccinated in case of enforcement in the first and second waves of the survey, respectively. The sum of those expressing either agreement level 3 or 4 under enforcement amounts to 56% in wave 1 and 42% in wave 2. Opposition to enforcement (levels 0 and 1) was expressed by 29% in wave 1 and 42% in wave 2 (1–0.71 and 1–0.58, respectively, that is, the final two steps in the graph).

