Fig. 3.
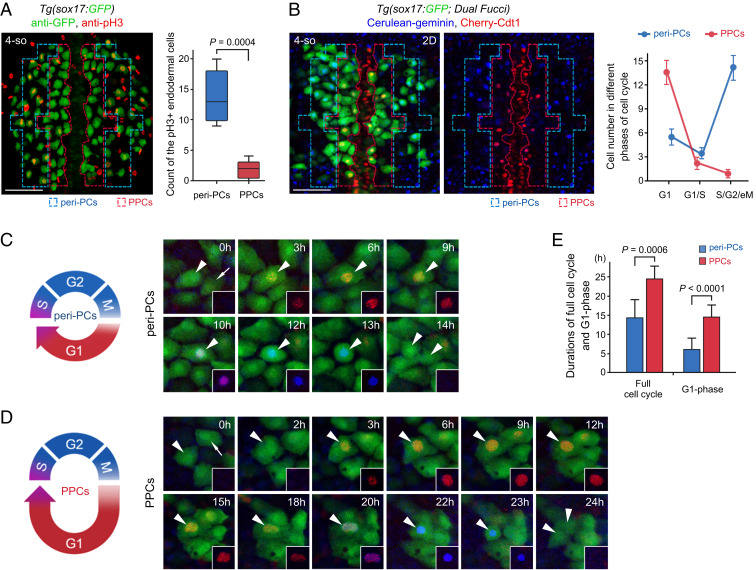
The cell cycle state of PPCs is featured by low proliferation and a long G1 phase. (A) Double immunostaining for pH3 (red) and GFP (green) in the Tg(sox17:GFP) embryos. The statistics show the number of cells double positive for pH3 and GFP in the peri-PC and PPC regions (n = 5). (B) The two-dimensional images of the Tg(sox17:GFP; Dual Fucci) transgenic line were captured covering the PPC and peri-PC regions at the 4-somite stage. The statistics show the average number of sox17+ cells in G1 phases (red), in G1/S transitions (red plus blue), and in S/G2/eM phases (blue). Note that five independent repeats represent five different embryos. (C–E) Diagrams and single-cell time-lapse live images of a full cell cycle of peri-PCs (C) and PPCs (D). The time windows between two consecutive mitotic telophases were exhibited. Arrowheads indicate the traced cells. The statistics show average durations of a full cell cycle and G1 phase of peri-PCs and PPCs (E, n = 10). (Scale bar, 50 μm.) 4-so, 4-somite stage. Data are expressed as mean ± SD; P value is calculated using Student’s t test.

