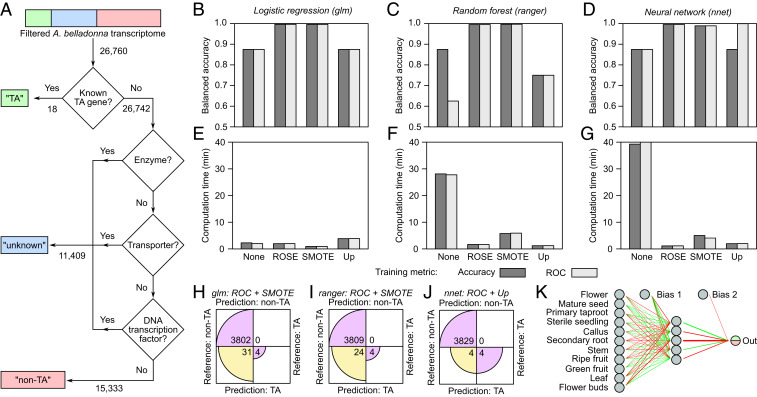
Fig. 2.
Training, optimization, and testing of binary classifier models for the prediction of TA-related genes from the A. belladonna transcriptome. (A) Flowchart used for the generation of training output values for A. belladonna transcripts following dataset preprocessing. “TA”: the transcript encodes the gene product with a known role in TA biosynthesis; “nonTA”: the transcript encodes the gene product known not to be involved in TA biosynthesis; “unknown”: the transcript encodes the gene product with an unknown role in TA biosynthesis. Values indicate the number of transcripts. (B–G) Model performance in training, cross validation, and testing. Three binary classifier models were trained using one of four different oversampling methods (none: no oversampling; ROSE: random oversampling examples; SMOTE: synthetic minority oversampling technique; up, random oversampling) and one of two different performance metrics (accuracy: fraction of correctly predicted samples out of the total number of samples; ROC: area under the receiver operating characteristic curve, which plots the true positive rate versus the false positive rate). Top Row (B–D) and Bottom Row (E–G), respectively, show predictive accuracy in testing and total computation time for training, 10-fold cross validation, and testing. (H–J) Confusion matrices showing predictive performance of each of the three optimized binary classifier models on testing data. LR (H), RF (I), and NN (J) binary classifiers were trained and cross validated using the oversampling techniques and performance metrics that yielded maximum balanced accuracy and minimum computation time in B through G. Note that circular wedges are only shown to scale within each matrix row. (K) Simplified schematic of the final optimized neural network with 11-5-1 architecture (performance shown in J). Green and red lines indicate positive- and negative-weight connections, respectively, and line thickness is proportional to absolute connection weight (Dataset S2). Dual-color output neuron reflects the binary output format for predictions: green (1) = TA or red (0) = nonTA.

