Fig. 5.
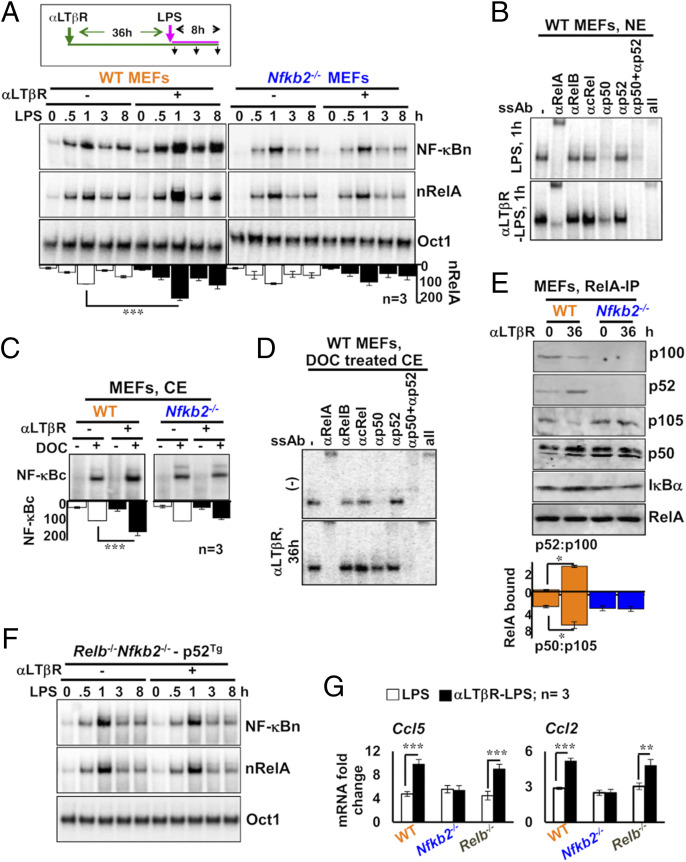
Nfkb2-dependent accumulation of latent RelA dimers in LTβR-stimulated MEFs augments canonical NF-κB responses. (A) EMSA revealing NF-κBn induced in WT and Nfkb2−/− MEFs in a stimulation time course (Top). Cells were treated with LPS alone or stimulated using agonistic αLTβR antibody for 36 h and then treated with LPS in the continuing presence of αLTβR. Ablating RelB and cRel DNA-binding activity using anti-RelB and anti-cRel antibodies, nRelA complexes were examined (Middle). Oct1 DNA binding (Bottom) served as a control. The data represent three experimental replicates. (B) The composition of NF-κBn complexes induced in naïve or LTβR-conditioned MEFs subjected to LPS treatment for 1 h was characterized by shift-ablation assay. (C) EMSA revealing the abundance of latent NF-κB dimers in the cytoplasm (NF-κBc) of WT and Nfkb2−/− MEFs subjected to αLTβR stimulation for 36 h. Cytoplasmic extracts were treated with DOC before being subjected to EMSA for unmasking latent NF-κB DNA-binding activities. The data represent three experimental replicates. (D) The composition of NF-κBc complexes accumulated in the cytoplasm of MEFs subjected to the indicated treatment regimes was determined by shift-ablation assay. (E) Immunoblot of RelA coimmunoprecipitates obtained using whole-cell extracts derived from αLTβR-treated MEFs. Band intensities were quantified from three independent experiments. Accordingly, the relative abundance of p52 to p100 (p52:p100) and p50 to p105 (p50:p105) in the RelA coimmunoprecipitate was determined and plotted (see below the gel picture). (F) p100-deficient Relb−/−Nfkb2−/− cells stably expressing p52 from a retroviral transgene were subjected to cell stimulation as described in A. Subsequently, NF-κBn or nRelA activities were captured in EMSA. Data represent two biological replicates. (G) qRT-PCR analyses revealing proinflammatory gene expressions induced by LPS in naïve or LTβR-conditioned MEFs of the indicated genotypes. Quantified data represent means ± SEM. Two-tailed Student’s t test was performed. ***P < 0.001; **P < 0.01; *P < 0.05.

