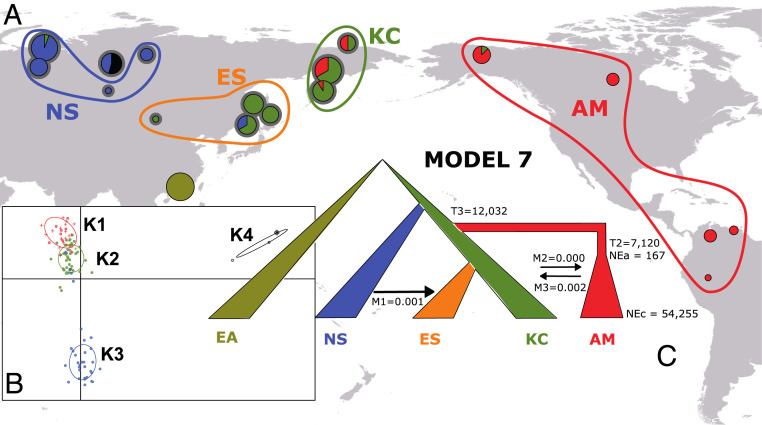
Fig. 4.
Reconstructing the colonization of the New World by hspIndigenousAmericas. (A) The geographic distribution of hspIndigenousAmericas subpopulations across Eurasia and the Americas. ABC was carried out on geographic populations rather than DAPC population clusters. The size of each pie represents the number of hspIndigenousAmericas strains isolated at each location, and slices represent the proportions of each DAPC-inferred populations from B, Inset. Newly sampled populations are denoted with a gray halo. (B) DAPC analysis of 123 hspIndigenousAmericas strains showing structuring into four populations. Newly sequenced strains are denoted with a filled circle, whereas reference strains are shown as crosses. An East Asian population (Hong Kong) was used as the outgroup. (C) The best supported of eight competing models with median posterior estimates. T2 is the time, in years, when the bottleneck underwent by the AM population stopped. T3 is the time, in years, when the AM population split from its common ancestor with populations ES and KC; NEa, ancestral effective population sizes; NEc, current effective population sizes; M, migration rates.

