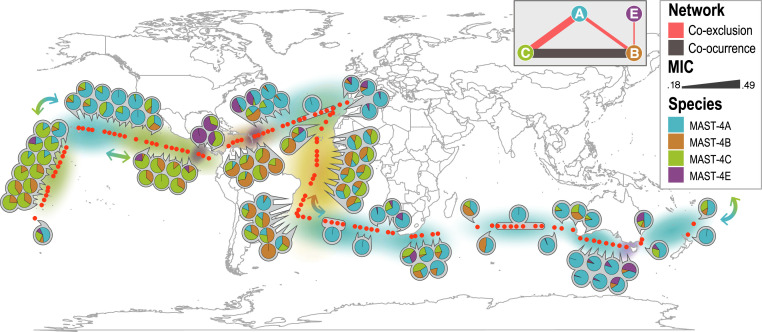
Fig. 1.
Distribution of MAST-4A/B/C/E species in the surface global ocean as inferred by OTUs based on the 18S rRNA gene (V4 region). Red dots show Malaspina stations while pie charts indicate the relative abundance of MAST-4 species at each station. (Top Right, Inset) The network shows the association patterns between each MAST-4 species as measured using MIC analyses. The width of the edges in the network shows association strength as indicated in the legend (MIC). Background color shows the most abundant MAST-4 species in the region. Arrows point to areas with an important switch of the abundant species; note that the most abundant species, A and C, alternate predominance in large oceanic regions.

