Fig. 4.
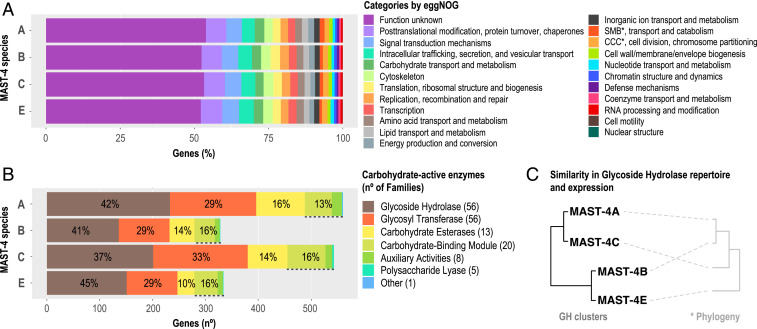
Functional profile of MAST-4 genes according to eggNOG and CAZy. Total MAST-4 genes analyzed were 15,508, 10,019, 16,260, and 9,042 for species A, B, C, and E, respectively. (A) eggNOG annotations indicated as percentage of genes falling into functional categories. SMB, Secondary Metabolites Biosynthesis; CCC, Cell Cycle Control. (B) Number of MAST-4 genes within CAZy categories and the corresponding percentage. The number of gene families considered within each CAZy category is indicated between parenthesis in the panel legend. (C) Clustering of MAST-4 species using Manhattan distances based on either their GH composition or the GH expression (in transcripts per million) results in the same clustering pattern. Note that MAST-4C and A are more similar in their GH content than E and B, which are more similar between themselves. *A schematic representation of the phylogeny of the studied MAST-4 is shown for comparison purposes (see Fig. 3 for more details).

