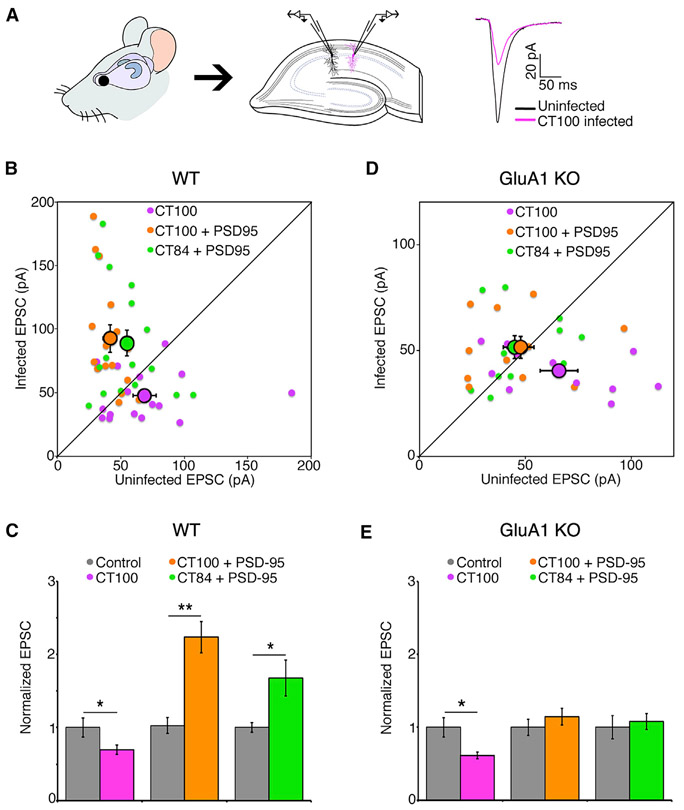
Figure 1. PSD-95 protects synapses from Aβ independently of synaptic potentiation.
(A) Left and middle: hippocampal organotypic slices used for dual-patch whole-cell recordings from an infected and neighboring uninfected CA1 neuron. Right: representative traces (mean of 40 consecutive trials) of evoked AMPA-receptor-mediated responses.
(B) Dot plot of excitatory post-synaptic current (EPSC) dual-patch recordings from WT tissue; infected neurons expressing indicated constructs; group average indicated by larger black outlined symbols. Error bars indicate SEM here and throughout.
(C) Bar graph of dual-patch recordings for indicated groups; responses normalized to uninfected controls (gray). *p < 0.05; **p < 0.001, paired t test; n ≥ 16 for each group.
(D) Same as in (B), but in slices made from GluA1 knockout animals.
(E) Same as in (C), but in slices made from GluA1 knockout animals; *p < 0.05, paired t test. n = 11 for each group.

