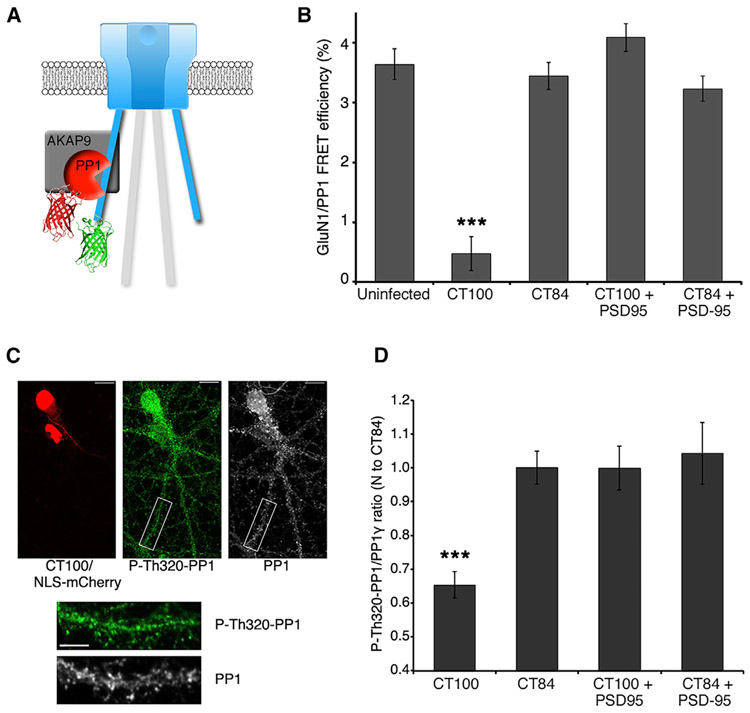
Figure 3. Aβ-decreased FRET between NMDAR and PP1 and increased PP1 activity are blocked by PSD-95.
(A) Diagram of the NMDAR with its GluN1-GFP subunit acting as a FRET donor for PP1-mCherry, which interacts with the NMDAR complex through interactions with AKAP9.
(B) Bar graph of FRET efficiency for indicated conditions. n > 20 neurons, >400 spines (for each condition). ***p < 0.0001, unpaired t test.
(C) Representative images of P-Thr320-PP1 and total PP1 immunostaining in neurons overexpressing CT100+NLS-mCherry, as indicated. Scale bars: 10 μm (top image) and 5 μm (lower images).
(D) Bar graph of average immunostaining intensity for ratio of P-Thr320-PP1 to total PP1 (normalized to CT84 values) in spines of neurons overexpressing the indicated constructs. n = 7–18 neurons (>1,000 spines) per condition. ***p < 0.0001, unpaired t test.

