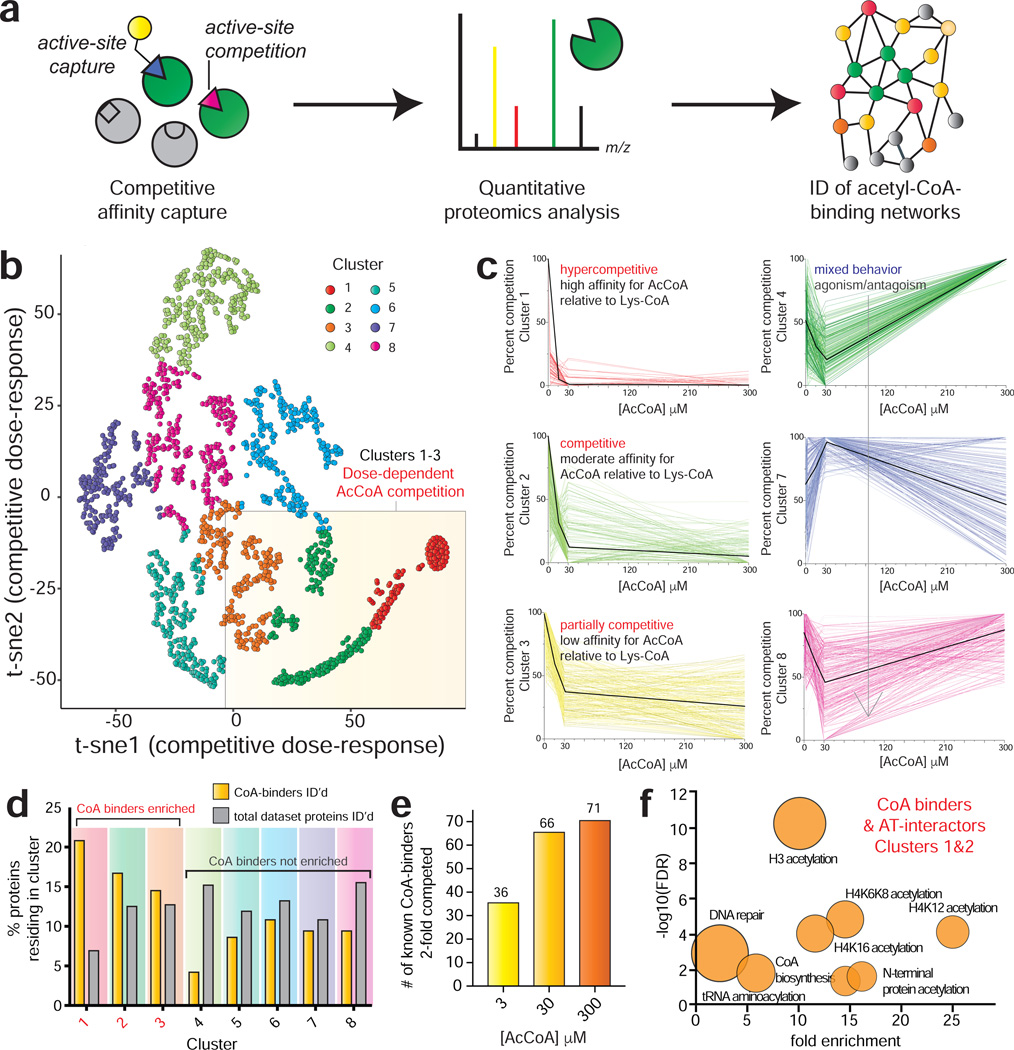
Figure 2.
Profiling acetyl-CoA/protein interactions using CATNIP. (a) Schematic for chemoproteomic analyses of acyl-CoA/protein interactions. (b) Normalized dNSAF values across 4 acetyl-CoA concentrations (0, 3, 30, 300μM) were t-SNE transformed and plotted in two dimensions for all proteins competed in CATNIP experiments (n=3 LC-MS/MS experiments). (c) Dose-response profiles of acetyl-CoA CATNIP clusters. Colored lines indicate the capture profiles of individual proteins at each concentration of acetyl-CoA competitor. Black lines indicate the mean capture profile for all proteins in a given cluster. (d) Clusters 1–3 are enriched in Uniprot-annotated CoA-binding proteins (“CoA binders”) as well as members of acetyltransferase complexes (”AT interactors”). (e) Analysis of annotated CoA binders exhibiting 2-fold competition at each concentration. Fold-change in d and e were calculated by QPROT. (f) Gene ontology analysis of CoA binders and AT interactors lying in CATNIP clusters 1 and 2. Fold enrichment of functional terms are plotted versus statistical significance (−log10[FDR]). Circle size reflects the number of proteins matching a given term. Functional enrichment was performed with the tool DAVID (https://david.ncifcrf.gov).

