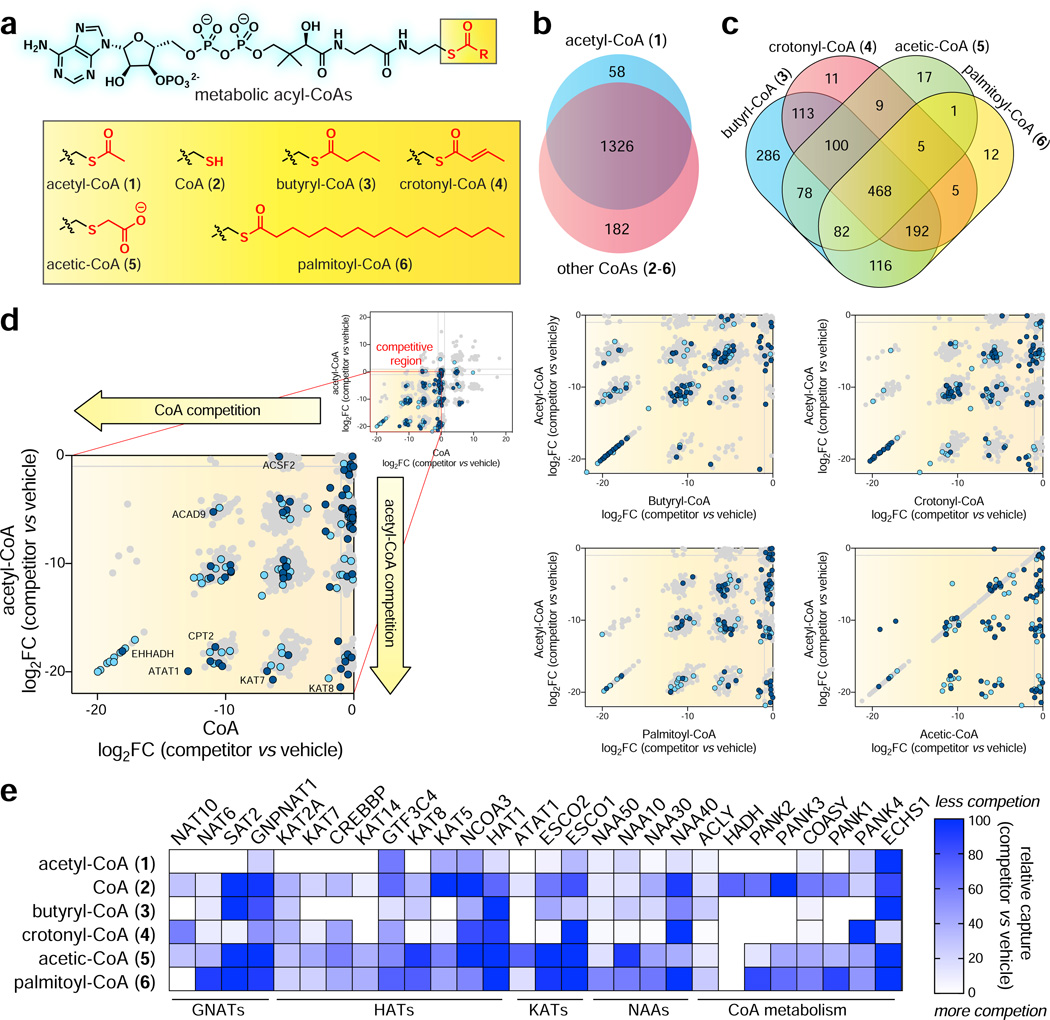
Figure 3.
Applying CATNIP to profile the comparative pharmacology of CoA metabolites. (a) CoA metabolites (1-6) analyzed in this study. (b) Venn diagram depicting overlap between proteins whose capture was competed more than four-fold by acetyl-CoA (1) or all other CoAs (2-6). (c) Venn diagram depicting overlap between proteins whose capture was two-fold competed by acyl-CoAs 3-6. (d) Comparison of acyl-CoA (x-axis) and acetyl-CoA (y-axis and acyl-CoA competition. Uniprot-annotated CoA binders and AT interactors are highlighted in dark blue and light blue, respectively. Log2FC values for b-d were calculated using QPROT. (e) Comparative CATNIP analysis highlights distinct signatures of metabolite interaction amongst families of CoA binders. Relative capture was calculated by comparing average dNSAF values. White = more competition by CoA metabolite, blue = less competition by CoA metabolite. All graphs are from n=3 control/competitor datasets.

