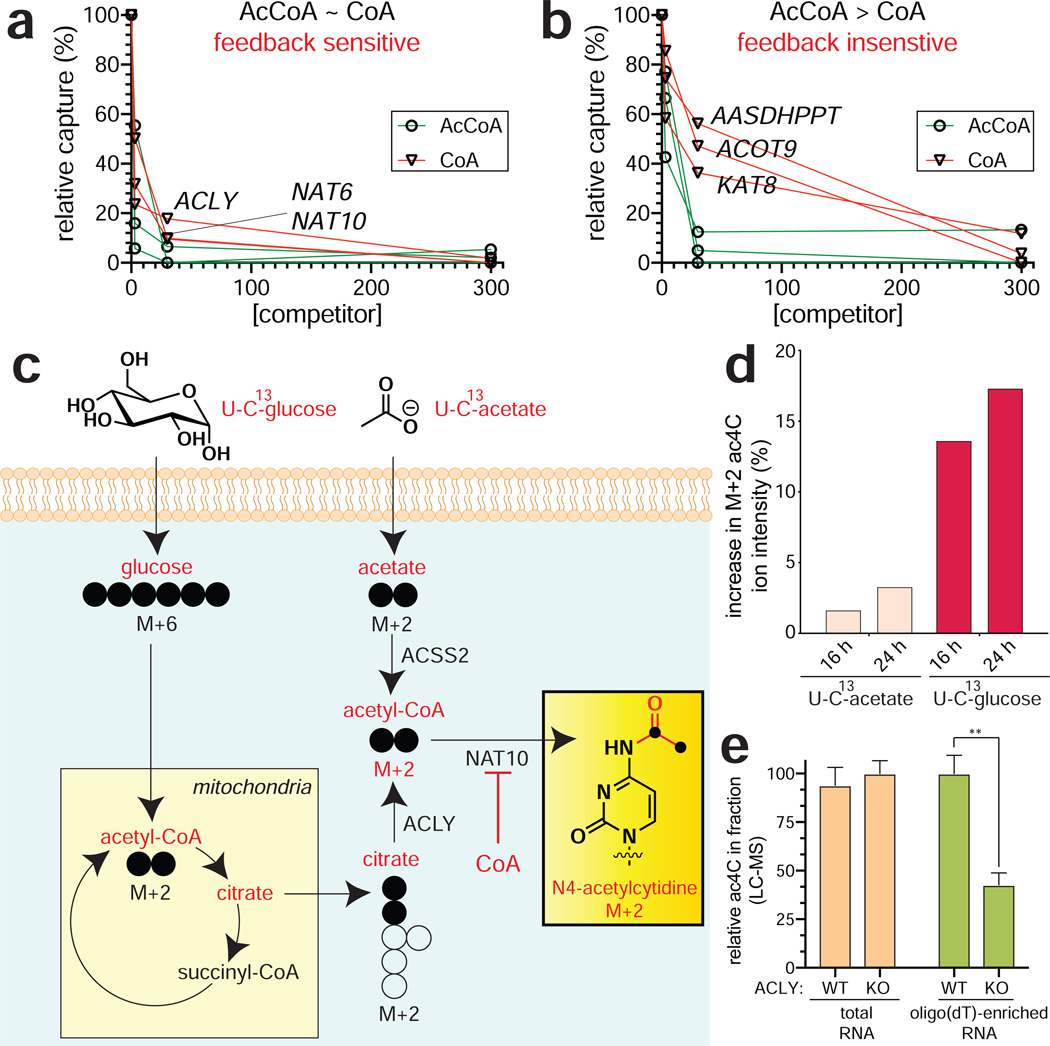
Figure 4.
Applying CATNIP to profile AT feedback inhibition. (a) Exemplary dose-response profiles of proteins that interact strongly with CoA. (b) Exemplary dose-response profiles of proteins more weakly with CoA. (c) Scheme for isotopic tracing of metabolic source of the acetate group in ac4C. Heavy (U-13C) glucose or acetate were applied in separate metabolic labeling experiments. Incorporation into ac4C was assessed by mass isotopomer analysis of digested total RNA. (d) The major source of ac4C’s N4-acetyl group is glucose. (e) Disruption of ACLY reduces levels of ac4C in poly(A)-enriched, but not total RNA. Values represent ≥ 3 replicates, analyzed by two-tailed student’s t-test (ns = not significant, *P<0.05, **P<0.01, ***P<0.001).

