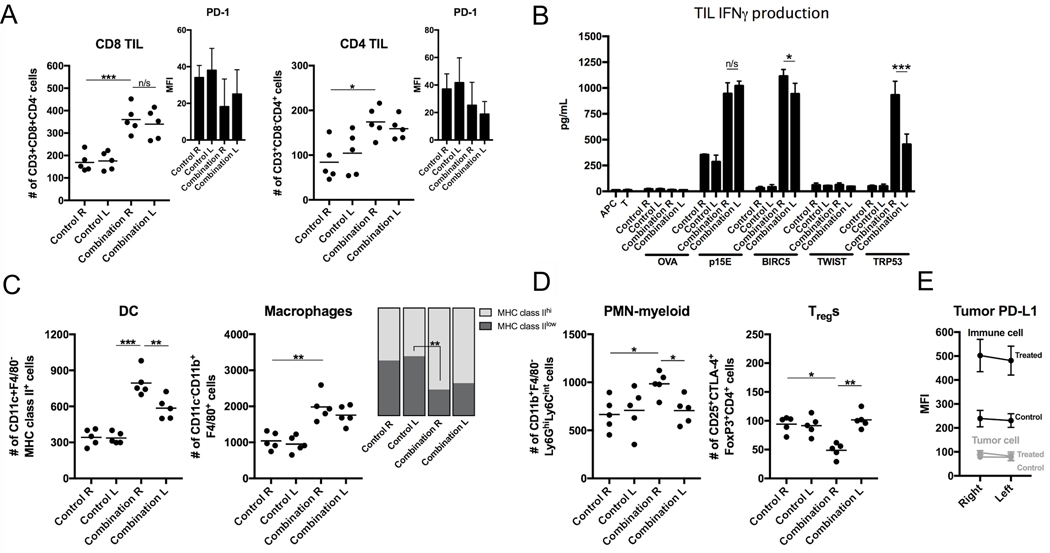
Figure 5. Immune correlative and functional effects of NIR-PIT and PD-1 mAb in mice bearing a bilateral MC38-luc tumors.
(A) Bilateral MC38-luc tumors (day 10, n = 5/group) treated with PD-1 mAb with or without NIR-PIT and bilateral control tumors were harvested, digested into single-cell suspensions, and analyzed for tumor-infiltrating lymphocytes (TILs) via flow cytometry. Presented as absolute number of infiltrating cells per 1.5 × 10⁴ live cells analyzed. PD-1 expression shown as inset (MFI, mean fluorescence intensity). *p < 0.05, ***p < 0.001, t test with ANOVA. Representative data from one of two independent expeirments shown. (B) TILs were extracted from tumors treated as above (n = 5/group) via an IL2 gradient, enriched via negative magnetic selection, and stimulated with irradiated splenocytes pulsed with peptides representing known MHC class I-restricted epitopes from selected tumor-associated antigens. IFNγ production was determined by ELISA from supernatants collected 24 hours after stimulation. Supernatants from splenocytes (APC) alone, TILs (T) alone, and a MHC-class I-restricted epitope from ovalbumin (OVA, SIINFEKL) were used as controls. *p < 0.05, ***p < 0.001, t test with ANOVA. (C) Flow cytometric analysis of tumor-infiltrating DCs and macrophages, with quantification of macrophage polarization based on MHC class II expression. **p < 0.01, ***p < 0.001, t test with ANOVA. (D) Flow cytometric analysis of tumor-infiltrating PMN-myeloid and Tregs. *p < 0.05, **p < 0.01, t test with ANOVA. (E) Flow cytometric analysis of PD-L1 expression on CD45.2–CD31–PDGFR– tumor cells. N = 5/group.

