Figure 2.
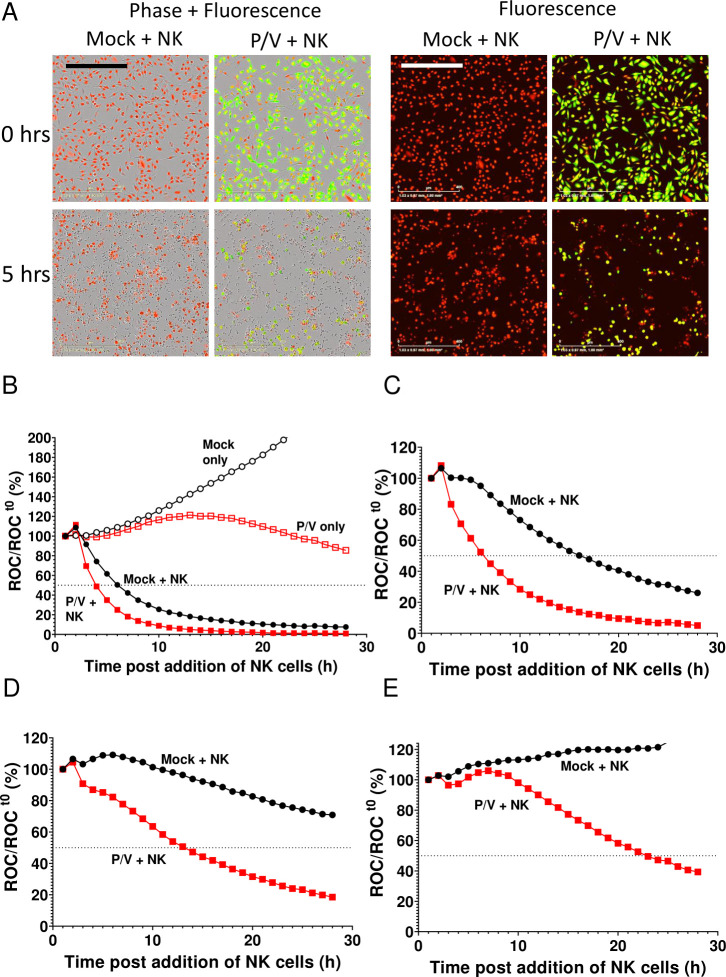
Real-time assay for PM21-NK cell killing of P/V virus-infected lung cancer cells. Monolayers of A549-NLR cells were mock infected or infected with the P/V mutant virus. At 16 hpi, cells were incubated with PM21-NK cells at different E:T ratios. Red fluorescence (red object count (ROC)) in the cultures was recorded at 1-hour intervals using the IncuCyte instrument and is expressed as per cent of time 0 when PM21-NK cells were added to culture. (A) Phase and fluorescence microscopy (10× magnification) of cultures at 0 and 5 hours postaddition of NK cells at an E:T of 5. The scale bar represents 400 µm. (B–E) Time-dependent red intensity curves for cultures of A549-NLR cells plus PM21-NK cells at E:T ratios of 10 (B), 5 (C), 2.5 (D) and 1.25 (E). Each timepoint represents the mean of three samples, with error bars representing SD. Dotted line indicated 50% mark. Note the y-axis scale is larger in (panel B) to accommodate the data from mock-infected cells alone and P/V virus-infected cells as controls. E:T, effector:target; NK, natural killer.

