Figure 7.
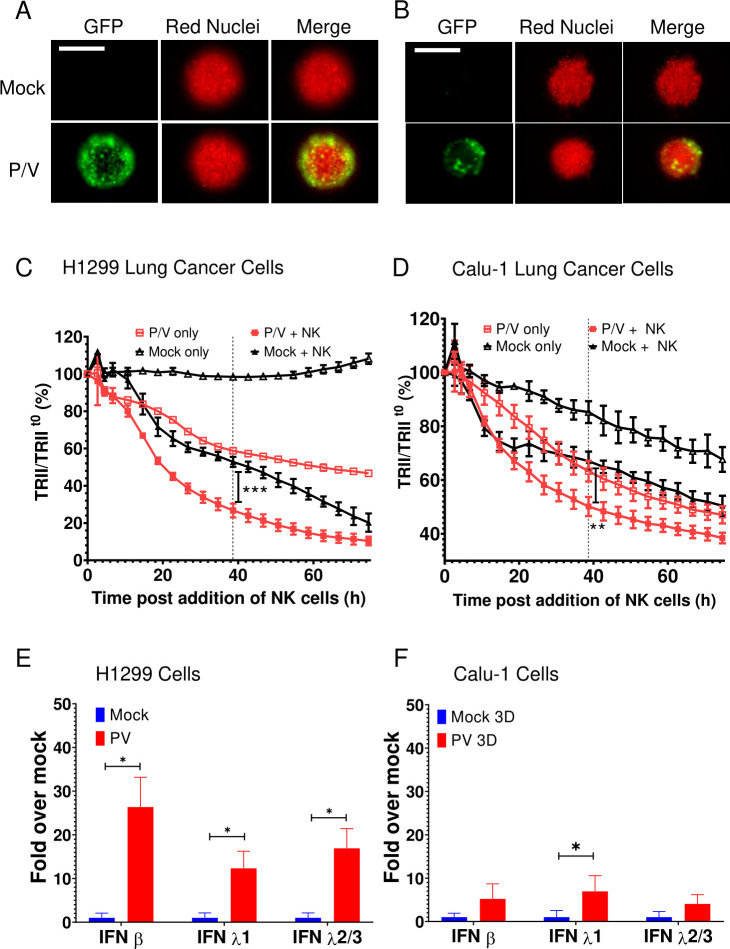
P/V virus infection of other lung cancer cells induces type I and type III IFN gene expression and leads to increased killing by PM21-NK cells. (A and B) Spheroid 3D cultures of H1299-NLR (A) and Calu-1-NLR (B) were mock infected or infected with P/V virus at an MOI of 50. Microscopy images at 10× were captured at D1 pi. The scale bar represents 200 μm. (C and D) At 16 hpi, PM21-NK cells were added to the H1299-NLR (panel C) and Calu-1-NLR (panel D) cultures at E:T ratios of 2.5 and red image fluorescence (TRII) was recorded on the IncuCyte instrument at 4-hour intervals. Each data point represents values from three individual spheroid cultures with bars representing the SD. (E and F) Spheroid cultures of H1299-NLR (panel E) or Calu-1-NLR (panel F) were either mock infected or infected with P/V virus at an MOI of 50. At 16 hpi, 32 spheroids were pooled and total cellular RNA was evaluated for the expression of IFN-β, IFN-λ1 and IFN-λ2/3 by RT-qPCR. Values are the mean of three biological replicates with error bars representing SD. For panels C and D, data was analyzed by two-way ANOVA test and by applying Tukey’s post hoc test when comparing the indicated data. For all graphs, the adjusted p values were *p<0.5; **p<0.01; ***p<0.001. ANOVA, analysis of variance; E:T, effector:target; IFN, interferon; MOI, multiplicity of infection; NK, natural killer; TRII, total red integrated intensity.

