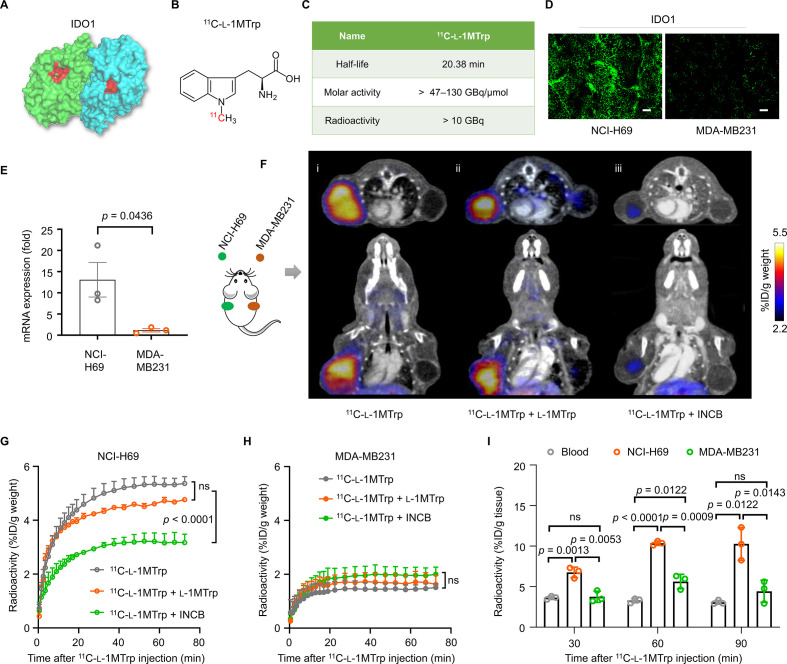
Figure 1.
11C-l-1MTrp imaging of IDO1 in human tumor models. (A) Protein structure of IDO1 (PDB ID: 2D0U). The blue and green colors indicate the subunits of the IDO1 dimer, and the red color indicates the tryptophan catalytic site. (B) Chemical structure of 11C-l-1MTrp. (C) Radio-characteristics of 11C-l-1MTrp. The half-life indicates the physical half-life of 11C-l-1MTrp. The molar activity and radioactivity were determined at the end of the synthesis (n=80) and showed an averaged synthesis time of 40 min from the end of the bombardment. (D) Immunostaining for IDO1 expression in tumor tissue samples from mice subcutaneously injected with 2.5×10⁶ NCI-H69 or MDA-MB231 cells. Green: Alexa Fluor 488-labeled anti-IDO1 antibody. Scale bar: 100 µm. (E) Quantification of IDO1 expression in NCI-H69 and MDA-MB-231 cells based on quantitative real-time reverse transcriptase-PCR. (F) Representative PET/CT images of tumor-bearing mice. Tumor positions: NCI-H69 tumor in the left flank and MDA-MB231 tumor in the right flank. Signal lower than 2.2% ID/g weight was subtracted of all PET images. (i) Representative coregistered 11C-l-1MTrp PET/CT image; (ii) Competition 11C-l-1MTrp PET/CT images after a coinjection of the ‘cold (opposite to the radiolabeled 11C-l-1MTrp)’ IDO1 inhibitor l-1MTrp (50 mg/kg) or (iii) INCB (INCB024360, 10 mg/kg). PET images were summed from 60 min to 75 min after 11C-l-1MTrp injection. (G, H) Time–activity curves of 11C-l-1MTrp in (G) NCI-H69 and (H) MDA-MB231 xenografts. (I) Ex vivo biodistribution data collected at 30, 60, and 90 min after 11C-l-1MTrp injection into xenograft mice. All comparisons were performed using an unpaired two-tailed Student’s t-test. Data represent the mean±SEM, n=3. IDO1, indoleamine-2,3-dioxygenase 1; PET, positron emission tomography.

