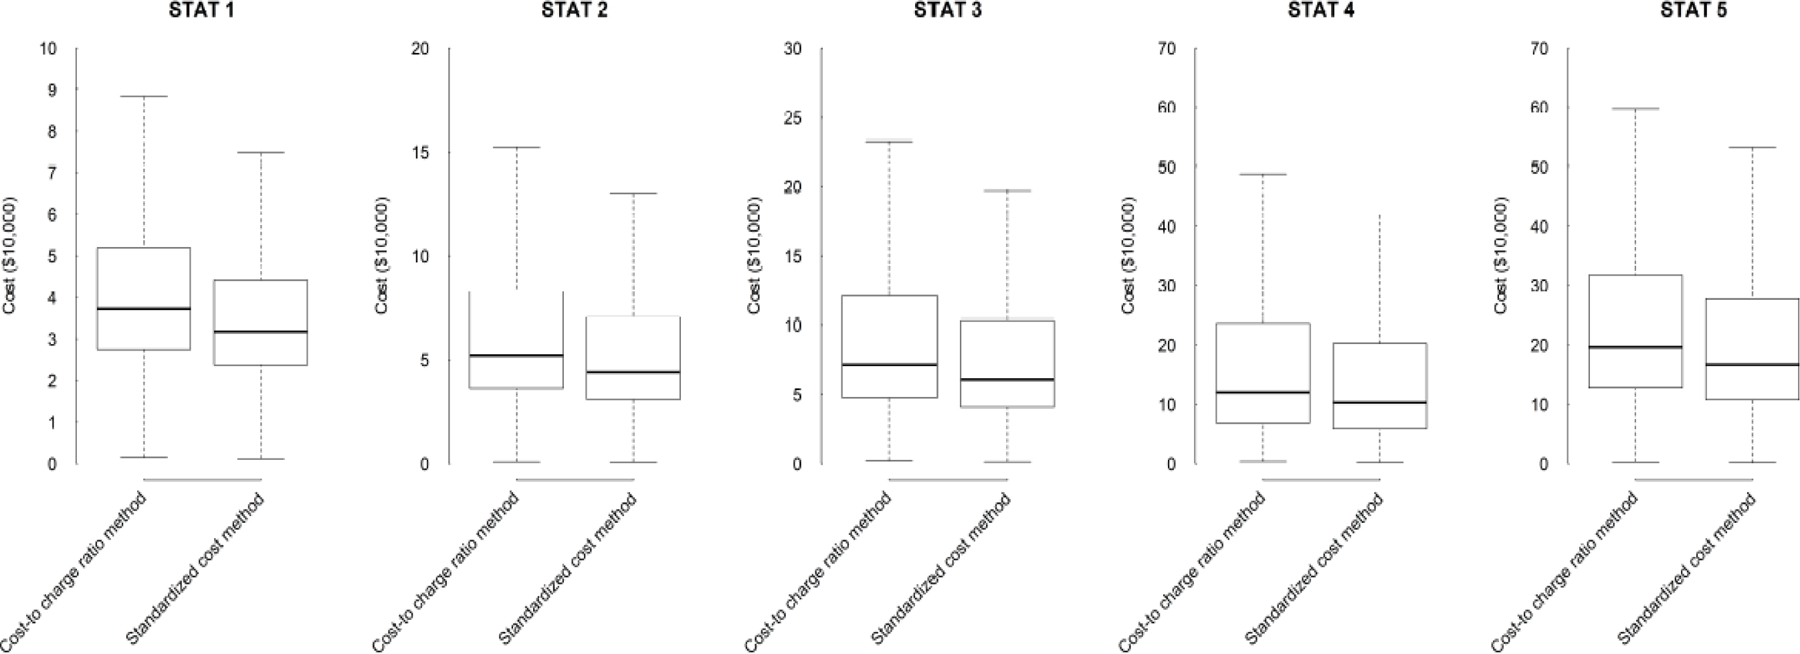
Figure 1. Resource Use Across STAT Categories by the Two Methods.

Box and whisker plots showing distribution of resource use by the two methods. The line represents the median, the box the interquartile range, and the upper and lower bars the range, excluding outliers.
