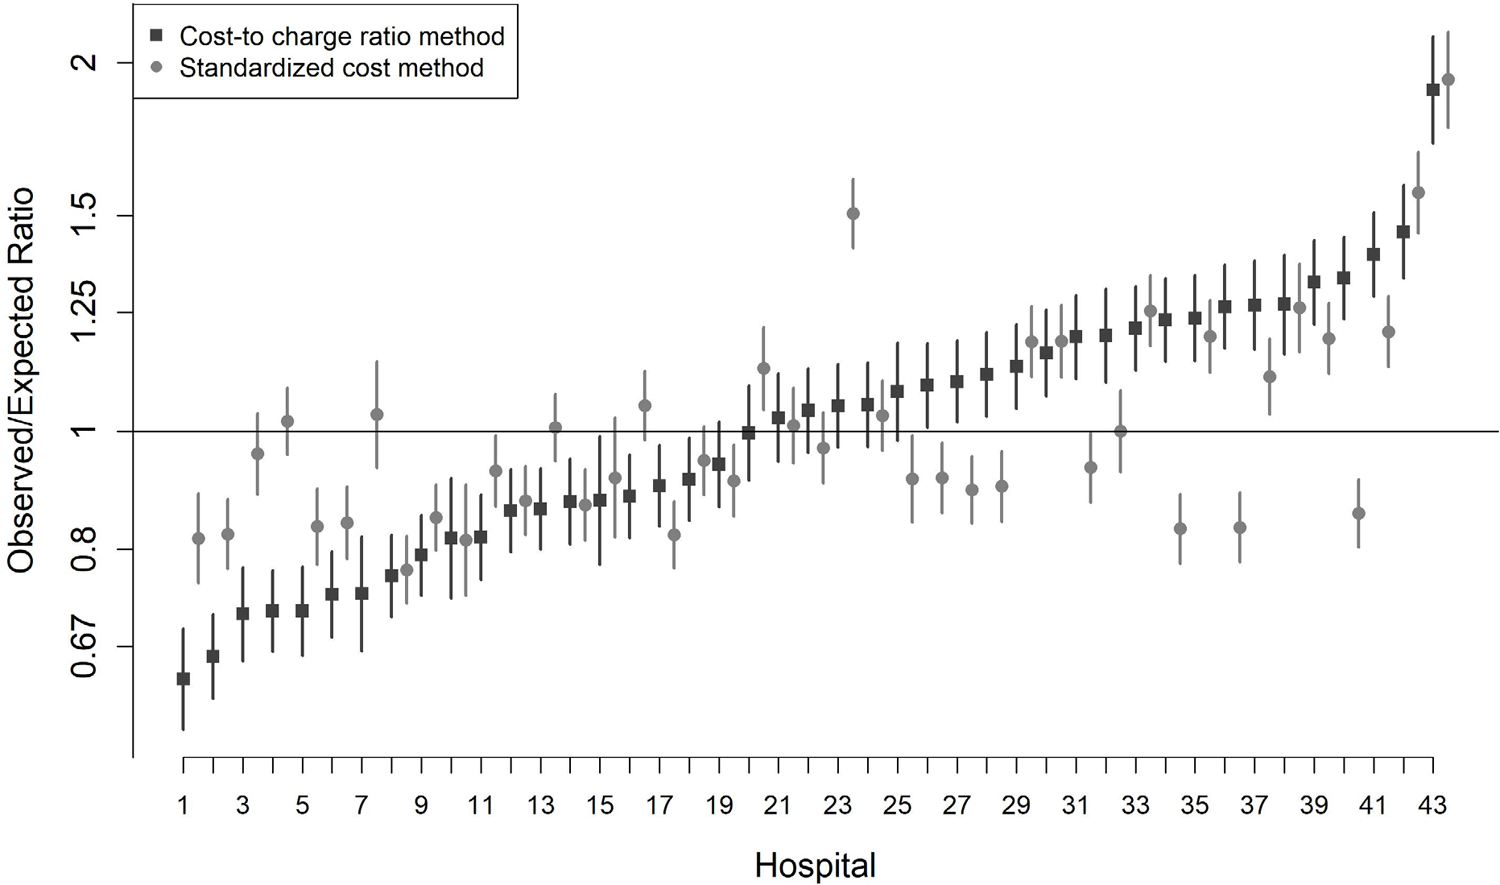
Figure 2. Case-mix Adjusted Resource Use Across Individual Hospitals by the Two Methods.

Observed-to-expected ratios and 95% confidence interval characterizing case-mix adjusted resource use are displayed. Two values are shown for each hospital, one calculated using the cost-to-charge ratio method (black) and the other using the standardized cost method (grey). Hospitals are ordered by increasing case-mix adjusted resource use as assessed by the traditional cost-to-charge ratio method. The two methods tended to diverge more frequently at the extremes, most prominently at the higher end of the resource use spectrum – here the standardized cost method (black) for many, but not all, hospitals produced lower estimates compared to traditional cost-to-charge ratio methods (grey).
