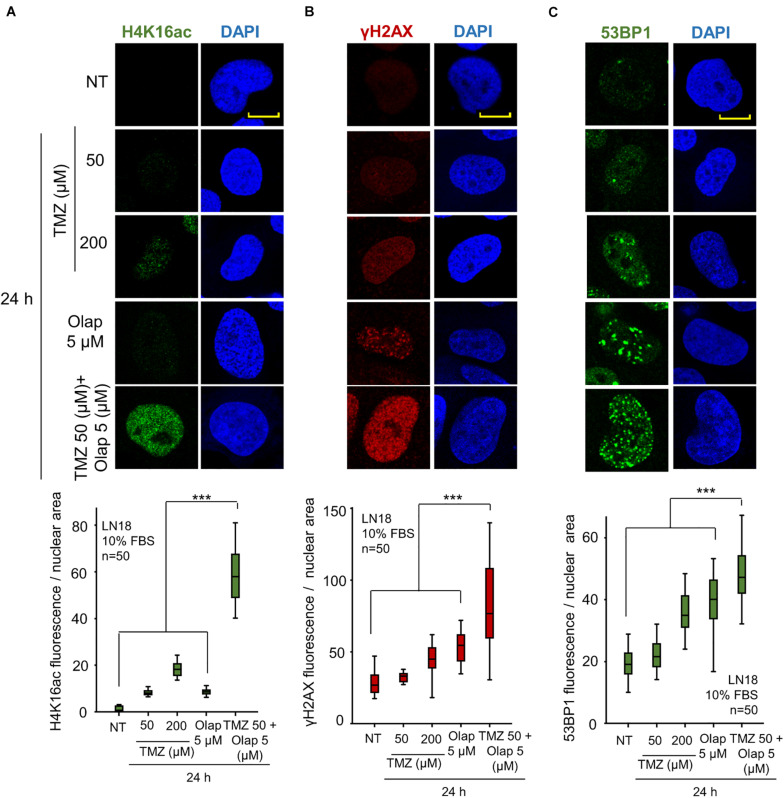
FIGURE 1.
Effect of the combination of TMZ and olaparib on H4K16 acetylation levels, γH2AX and 53BP1 foci formation in response to DNA damage in LN-18 glioblastoma cells. (A) Effect of TMZ 50 and 200 μM, olaparib 5 μM and the combination of TMZ 50 and olaparib 5 μM on H4K16ac shown by immunofluorescence (IF). (B) Effect of TMZ 50 and 200 μM, olaparib 5 μM and the combination of TMZ 50 and olaparib 5 μM on γH2AX shown by IF. (C) Effect of TMZ 50 and 200 μM, olaparib 5 μM and the combination of TMZ 50 and olaparib 5 μM on 53BP1 shown by IF. Scale bar = 10 μm. ***p < 0.001. The quantification of fluorescence levels per nuclear area from fifty cells in triplicate is shown at the bottom. NT: no treatment. Scale bar = 10 μm. ***p < 0.001. Field images shown in Supplementary Figure 1.

