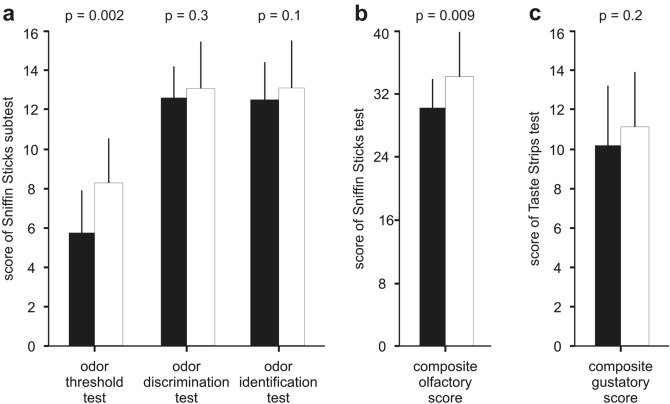
Fig. 1.
The figure shows the results of the three Sniffin Sticks sub-scores (a), results of the composite olfactory score from the Sniffin Sticks (b), and the results of the composite gustatory score from the Taste Strips (c). The black bars represent the results for the subjects with idiopathic blepharospasm and the white bars represent the results for the healthy controls. Values are presented as means and standard deviations. P values refer to the results of the Mann–Whitney U test

