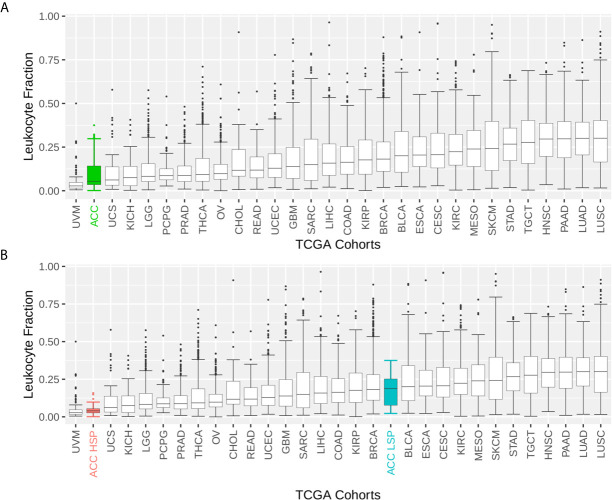
Figure 1.
Boxplot of the leukocyte fraction in the tumor microenvironment of 30 TCGA solid tumors. The leukocyte fraction was inferred by Thorsson et al. (11) for 10,448 participants included in The Cancer Genome Atlas (TCGA) database using molecular methods and compared with hematoxylin and eosin stained images, which demonstrated good correlation. Participants were grouped by TCGA cohort. The boxplot shows the median and interquartile range (IQR) for the leukocyte fraction of each cohort. Whiskers are set at 1.5 IQR and outliers (above and below the 1.5 IQR) are presented as points. TCGA cohorts were ordered by median values. (A) Patients with adrenocortical carcinoma (ACC) are represented as one group. (B) Patients with ACC are divided according to steroid phenotypes.

