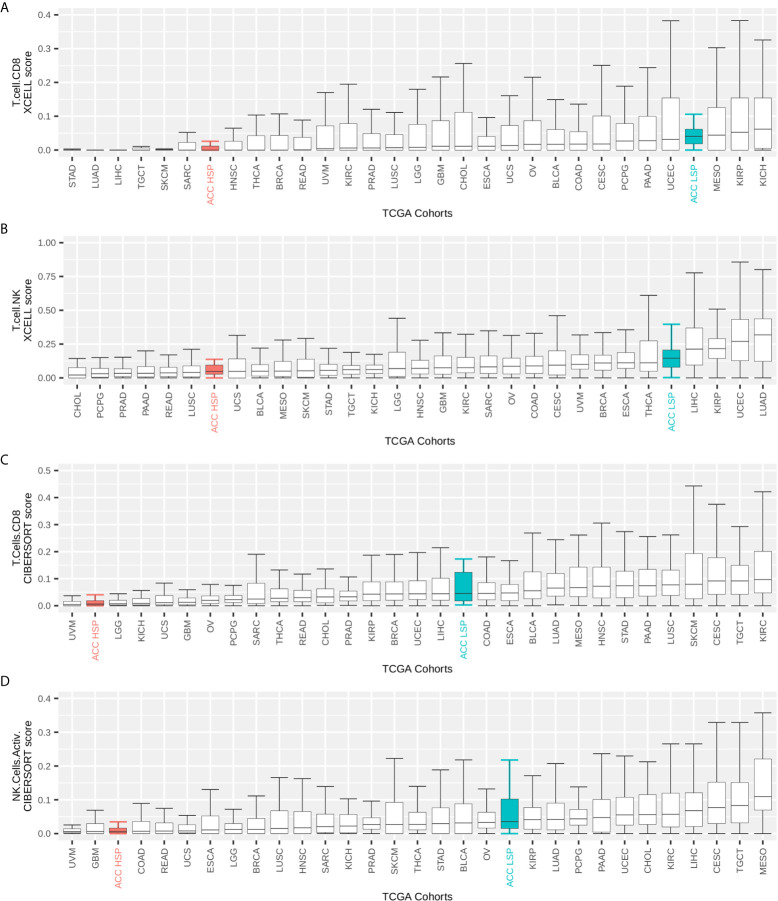
Figure 2.
TCGA pan-cancer comparison of immune infiltrates. Immune infiltrate scores (y-axis) were rescaled to range from 0 to 1. The maximum on the y-axis is independently set for each plot for better visualization. Participants were grouped by TCGA cohort and the boxplot shows median and IQR for immune cell infiltrate scores of each cohort. Whiskers are set at 1.5 IQR and outliers (above and below the 1.5 IQR) are not shown. TCGA cohorts were ordered by median values. Patients with ACC were divided according to steroid phenotypes (A, B) xCell scores for CD8+ T cells and T natural killer (NK) cells inferred by Sturm et al. (39). (C, D) Cibersort scores for activated CD8+ T cells and NK cells as inferred by Thorsson et al. (11) and multiplied by the leukocyte fraction as described by these authors.

