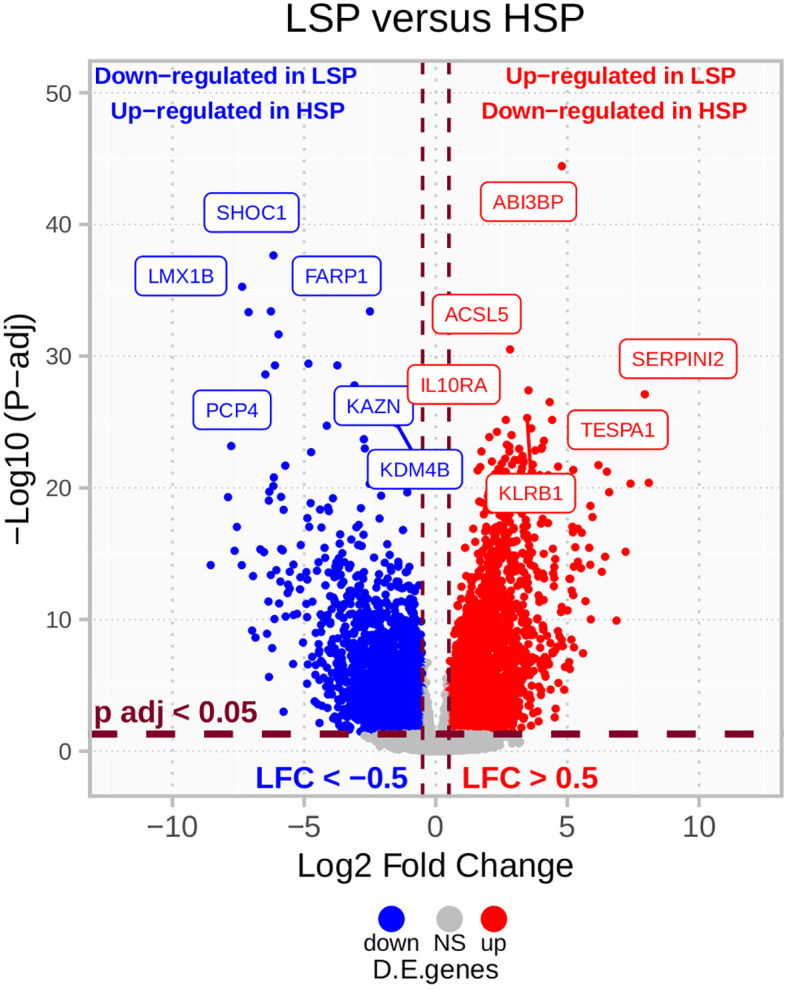
Figure 3.

LSP versus HSP DE in TCGA ACC cohort (n = 78). After filtering for protein-coding genes and excluding those with sums of zero counts, a total of 19,169 genes were used for a LSP versus HSP differential expression (DE) analysis. P-values were calculated using the Wald’s test and adjusted using Benjamini-Hochberg estimation. Genes with absolute log2 fold change lower than 0.5 and adjusted p-value greater than 0.05 are colored in gray. Above these cut-offs, genes upregulated in LSP and downregulated in HSP are indicated in red and genes downregulated in LSP and upregulated in HSP are indicated in blue.
