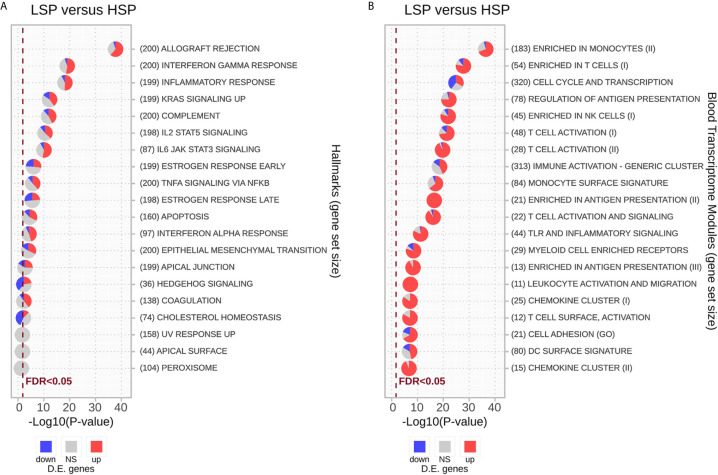
Figure 4.
Enrichment analysis for differentially expressed genes using the CERNO test. The CERNO test was applied to the differentially expressed genes using the hallmark gene sets (A) and blood transcriptome modules (BTMs) (B). The modules are ordered according to the adjusted p-values and are considered non-significant based on a false discovery rate (FDR) of 0.05. The number of genes in each module is presented before the module names in brackets. The charts are colored based on the DE results: red for module genes upregulated in low steroid phenotype (LSP) and downregulated in high steroid phenotype (HSP), gray for module genes with no significant p-value, and blue for module genes down-regulated in LSP and upregulated in HSP.

