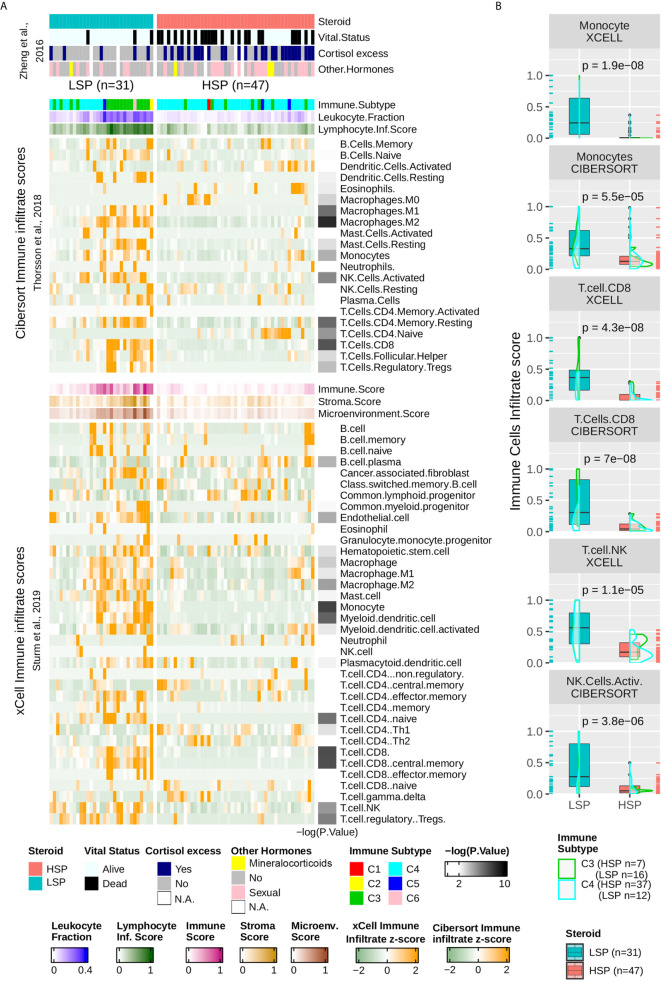
Figure 5.
Immune infiltrate comparison. (A) Heatmap with column-wise z-scores for TCGA ACC immune infiltrates as inferred by Sturm et al. (39) using xCell and by Thorsson et al. (11) using Cibersort. Maximum and minimum z-scores for the color gradient were set at +2 and −2 standard deviations from the mean. Each column represents a patient and columns were subjected to semi-supervised clustering. In addition to the immune infiltrate, Thorsson et al. (11) presented a classification of six immune subtypes (C1–C6) and inferred the leukocyte fraction and a molecular signature associated with the lymphocyte infiltrate score. xCell provides a stroma, immune, and microenvironment score in addition to the immune cell infiltrate. Lymphocyte infiltrate, immune, stroma, and microenvironment scores were rescaled to a range of 0 to 1. The clinical information was provided by Zheng et al. (5) and appears in the top annotation rows. The p-value calculated using the Wilcoxon test comparing LSP and HSP for each cell type is represented in the right as a color gradient ranging from 2 to 10 for −log10 (p-value), values lesser than 2 are set as white. (B) Boxplot comparing LSP and HSP in terms of monocytes, CD8+ T cells (xCell and Cibersort), T natural killer (NK) cells (xCell), and activated NK cells (Cibersort). All scores (y-axis) are rescaled from 0 to 1. The density plot shows the distribution according to the immune subtypes: C3 (green) and C4 (cyan). Each sample is shown in a rug plot and colored according to the HSP and LSP classification. The p-value calculated using the Wilcoxon test comparing both phenotypes is shown above each pair of boxplots.

