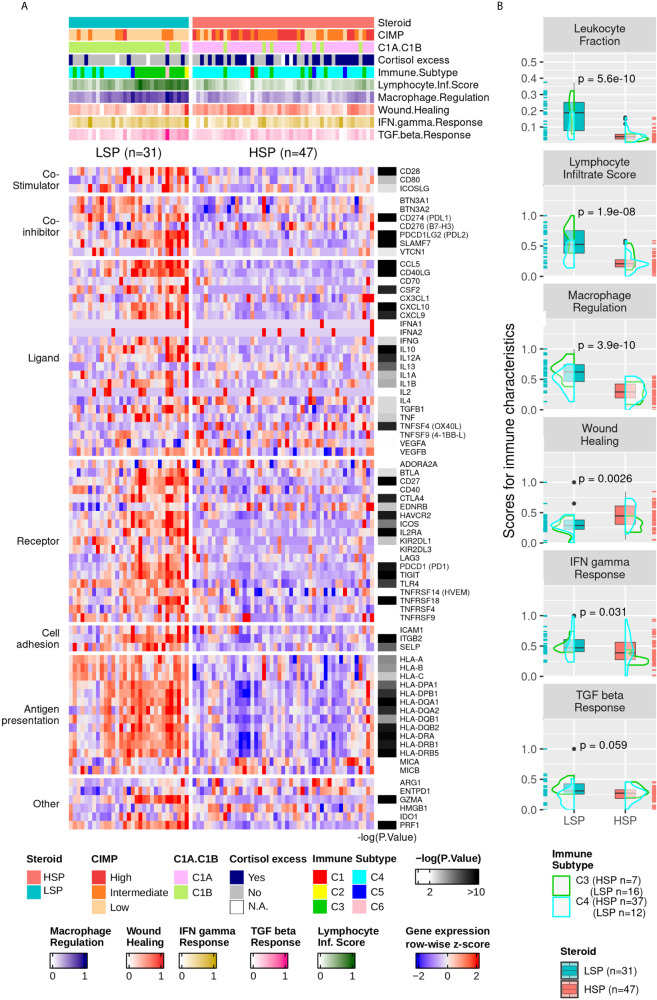
Figure 6.
Gene expression of immune modulators and Thorsson and colleagues’ immune signatures. (A) Heatmap with column-wise z-scores for expression of immune modulator genes. The maximum and minimum z-scores for the color gradient is set at +2 and −2 standard deviations from the mean. Each column represents a patient. The order from Figure 5A was maintained. The p-value for the DE analysis for each gene determined using the Wald’s test is represented in the right. The −log10 (p-value) color gradient is set as white up to the minimum value of 2 and the maximum is set to 10; however, its range exceeds 20 for GZMA, CCL5, and CD40LG. The absolute p-values for all differentially expressed genes can be found in Supplementary Table 1 . *Clinical cortisol excess and the molecular classification were described by Zheng et al. (5) and presented in the top annotation. **Immune subtype classification and the five molecular immune signatures rescaled to a range of 0 to 1 were according to Thorsson et al. (11) and are shown in the top annotation. (B) Boxplot comparing LSP and HSP for leukocyte fractions and the five immune signatures associated with lymphocyte infiltrate scores, macrophage regulation, wound healing, IFN-γ response, and TGF-ß response according to Thorsson et al. (11). The scores for each of the five signatures are rescaled to a range of 0 to 1 (y-axis). The density plot shows the distribution according to the immune subtypes C3 (green) and C4 (cyan). Each sample is shown in a rug plot and colored according to HSP and LSP classification. The p-value calculated using Wilcoxon test comparing both phenotypes is shown above each pair of boxplots.

