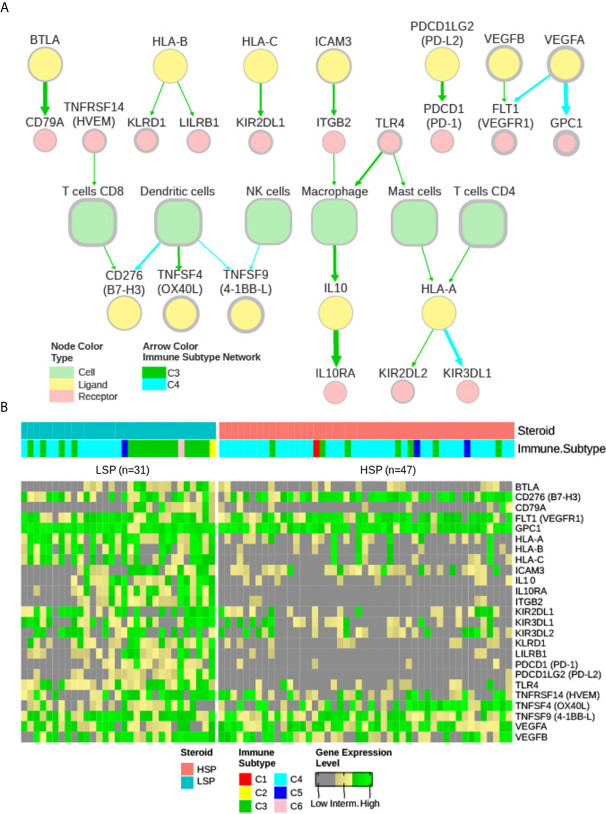
Figure 7.
iAtlas explorer-extracellular communication network. (A) The extracellular communication network according to Thorsson et al. (11) and available on CRI Atlas (https://isb-cgc.shinyapps.io/shiny-iatlas/) was reconstructed for the C3 and C4 patients of TCGA ACC cohort. Nodes with greater than 50% abundance and a concordance interaction larger than 2.5 were selected. The node line width varies proportionally to abundance and the edge width varies proportionally to concordance. Green arrows represent interactions of C3 patients and cyan arrows represent interactions of C4 patients. Node colors represent immune cells (light green), receptors (pink), and ligands (yellow). (B) The receptors and ligands present in the network were evaluated based on gene expression levels in a pan-cancer comparison. Gene expression of the 25 nodes in the network were ranked among 9,361 primary tumor samples available in the TCGA database and classified as low (grey), intermediate (yellow), or high (green) expression level based on ranking terciles. Each column represents a patient with ACC. Column order is maintained from Figures 5A and 6A heatmaps. Steroid phenotype and immune subtype classifications are indicated in the top annotation.

