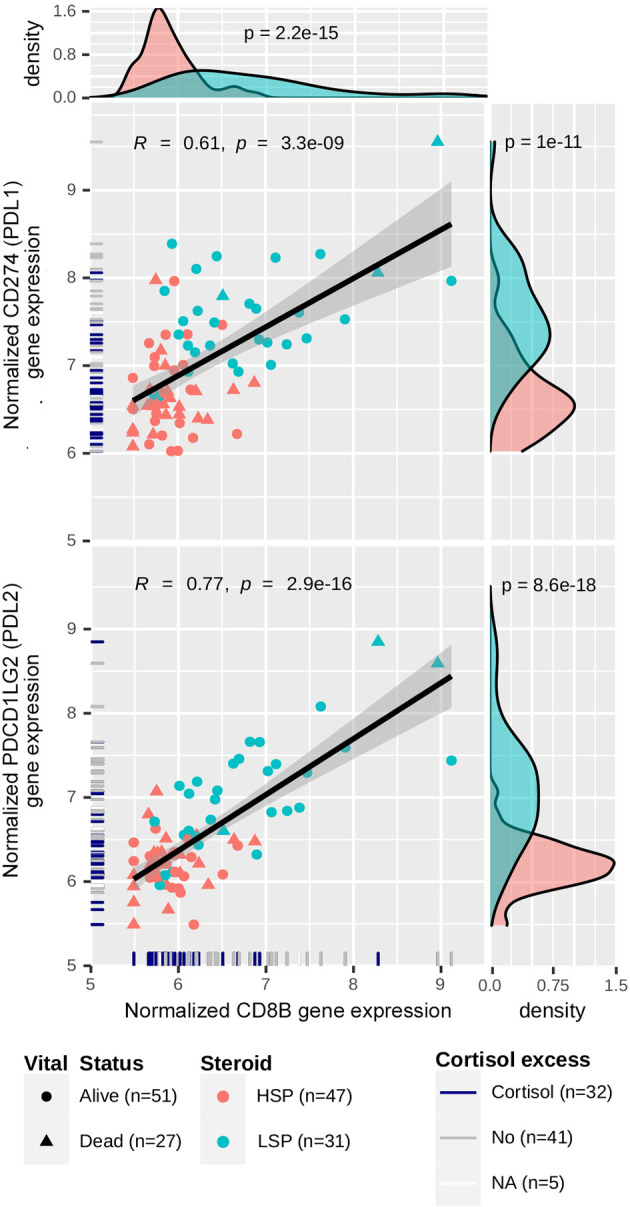
Figure 8.

Correlation between CD274/PDCD1LG2 and CD8B expression. Gene expression levels for CD274, PDCD1LG2 and CD8B were normalized using a variance-stabilizing transformation from DESeq2 R package. Pearson’s correlation coefficients and p-values are shown in the scatter plots, as well as the regression line. The confidence interval was inferred using Fisher’s Z transform. Point colors are set according to the steroid phenotype: salmon for HSP and blue for LSP. Point shapes are set according to the patient’s vital status: triangles for dead and circles for alive. In the rug plot, navy blue indicates the presence of cortisol excess, gray indicates absence, and white indicates non-annotated patients regarding cortisol levels. In the density plot, p-values determined using Wald’s test for DE analysis between LSP and HSP is shown.
