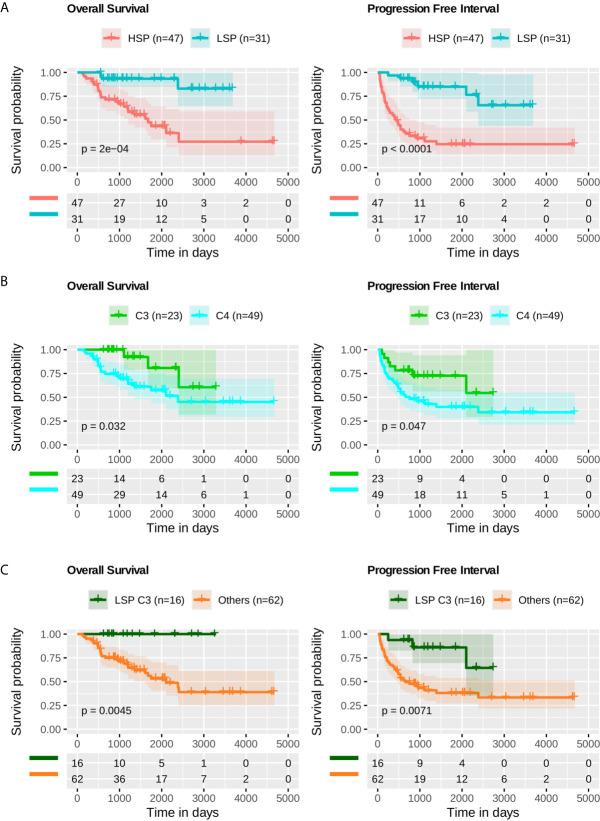
Figure 9.
Survival analysis. Kaplan-Meier analysis for overall survival (OS) and progression free interval (PFI) of ACC profiles. The p-value was calculated using a log-rank test and the confidence interval is shown. Below each plot a survival table with the absolute number of participants over time. (A) OS and PFI for LSP (n = 31) versus HSP (n = 47). (B) OS and PFI for immune subtype C3 (n = 23) versus immune subtype C4 (n = 49). (C) OS and PFI for LSP and C3 patients (n = 16) versus other combinations (LSP C2, C4, C5, and C6, or HSP C1, C3, C4, and C5; total n = 62).

