Figure.

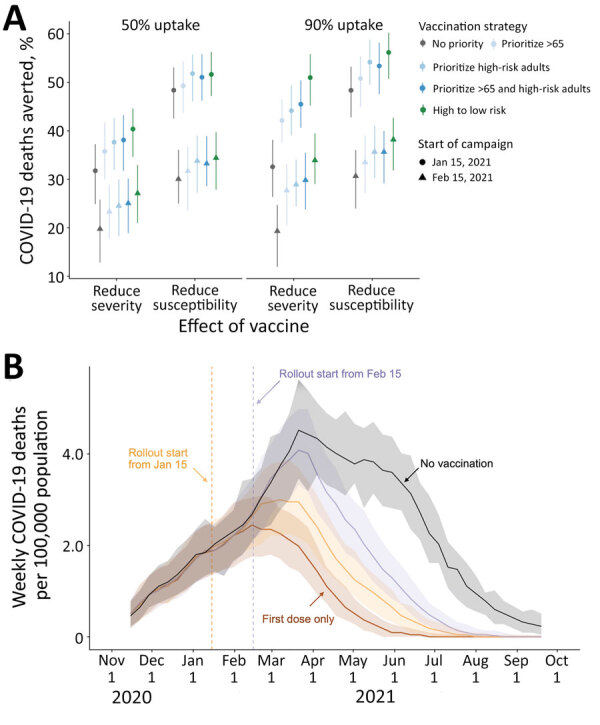
Projected COVID-19 deaths and deaths averted in the Austin–Round Rock Metropolitan Statistical Area (Austin, TX, USA) under various vaccine rollout scenarios for November 8, 2020–September 17, 2021. A) COVID-19 deaths averted after January 15, 2021, under combinations of vaccine uptake of 50% (left) or 90% (right); type of protection, either infection blocking (reducing susceptibility) or symptom blocking (reducing severity); rollout dates, either January 15 (circles) or February 15 (triangles); and risk prioritization, either no priority (gray), prioritize all adults >65 years of age (light blue), adults with high-risk underlying conditions (medium blue), or the combination of the two (dark blue), or a 10-phase risk-ordered strategy (green) that sequentially vaccinates >65 y high risk, 50–64 y high risk, >65 y low risk, 18–49 y high risk, 50–64 y low risk, 18–49 y low risk, 0–4 y high risk, 5–17 y high risk, 0–4 y low risk, 5–17 y low risk. Points and whiskers indicate the median and 95% CI across 200 paired stochastic simulations. B) Weekly incident COVID-19 deaths per 100,000 population, assuming intermediate (70%) uptake (6) without vaccine (black) or under a 10-phase risk-based rollout of a 95% efficacious infection-blocking vaccine, starting either January 15 (orange) or February 15 (purple). The brown line assumes that only first doses are administered starting January 15. Solid lines and shading indicate the median and 95% CI across 200 stochastic simulations. COVID-19, coronavirus disease.
